

What's behind IPG Photonics's latest 4.0% stock pullback?

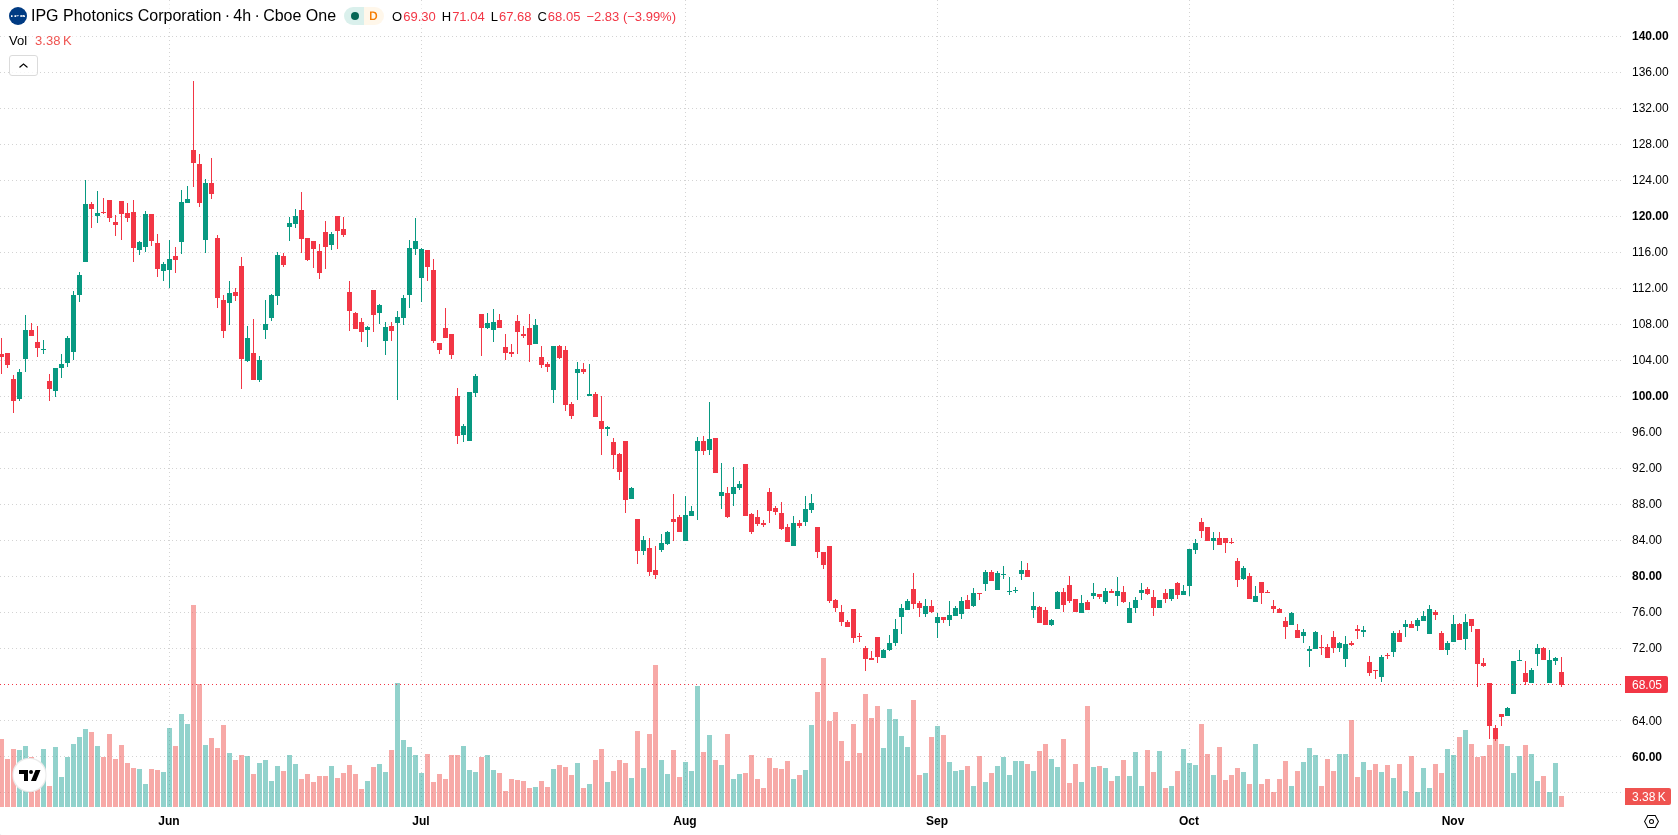
IPG Photonics Corporation (IPGP) fell 3.97% today as heavy selling pressure and confirmed downtrends across all key moving averages drove the decline. The move is reinforced by the stock's position below its 20-, 50-, and 200-day averages, with immediate technical resistance overhead.
 70.97
72.29
Highlights
- Shares of IPG Photonics trade below key moving averages with bears controlling short-, medium-, and long-term trends.
- Current intraday session shows the stock down $2.81 or 3.97%, with volatility at 4.81% and sellers in control.
- Expected five-day range is $64.9 to $71.2, with a 72% probability of further downside in the near term.
Persistent bearish setup as major averages align with volatile momentum
IPGP is trading at $68.05, below its 20-day ($71.39), 50-day ($75.5), and 200-day ($100.54) moving averages, indicating persistent downward pressure across all timeframes. The 50-day average remains below the 200-day, confirming a bearish technical alignment, with resistance at $68.16 and support at $66.05. Momentum metrics point to weak conditions: the MACD shows strong selling signals, while the ADX, RSI, and CCI all read neutral, but the Stochastic RSI signals potential downside correction risk due to its overbought status. BBP shows buyers hold a slight intraday edge, but price action stays near session lows with elevated volatility.
Earlier, analysts noted that IPG Photonics was experiencing sustained bearish momentum and continued selling pressure below key technical levels. This latest move reinforces that negative trend, with volatility elevated and the $66.05 support level now critical for traders assessing downside risk in the near term.






Latest IPG Photonics Corporation News



-
 Afghanistan
-
 Albania
-
 Algeria
-
 Angola
-
 Argentina
-
 Armenia
-
 Australia
-
 Austria
-
 Azerbaijan
-
 Bahamas
-
 Bahrain
-
 Bangladesh
-
 Belarus
-
 Belgium
-
 Bolivia
-
 Botswana
-
 Brazil
-
 Brunei
-
 Bulgaria
-
 Cambodia
-
 Cameroon
-
 Canada
-
 Chile
-
 China
-
 Colombia
-
 Congo
-
 Costa Rica
-
 Cote d'Ivoire
-
 Croatia
-
 Cuba
-
 Cyprus
-
 Czechia
-
 DR Congo
-
 Denmark
-
 Dominican Republic
-
 Ecuador
-
 Egypt
-
 El Salvador
-
 Estonia
-
 Eswatini
-
 Ethiopia
-
 Finland
-
 France
-
 Georgia
-
 Germany
-
 Ghana
-
 Greece
-
 Haiti
-
 Hong Kong
-
 Hungary
-
 India
-
 Indonesia
-
 Iran, Islamic republic
-
 Iraq
-
 Ireland
-
 Israel
-
 Italy
-
 Jamaica
-
 Japan
-
 Jordan
-
 Kazakhstan
-
 Kenya
-
 Korea
-
 Kuwait
-
 Kyrgyzstan
-
 Laos
-
 Latvia
-
 Lebanon
-
 Lesotho
-
 Libya
-
 Lithuania
-
 Luxembourg
-
 Madagascar
-
 Malaysia
-
 Malta
-
 Mauritius
-
 Mexico
-
 Moldova
-
 Mongolia
-
 Montenegro
-
 Morocco
-
 Mozambique
-
 Myanmar
-
 Namibia
-
 Nepal
-
 Netherlands
-
 New Zealand
-
 Nigeria
-
 North Macedonia
-
 Norway
-
 Oman
-
 Pakistan
-
 Palestine
-
 Panama
-
 Papua New Guinea
-
 Paraguay
-
 Peru
-
 Philippines
-
 Poland
-
 Portugal
-
 Puerto Rico
-
 Qatar
-
 Reunion
-
 Romania
-
 Rwanda
-
 Saudi Arabia
-
 Serbia
-
 Singapore
-
 Slovakia
-
 Slovenia
-
 Somalia
-
 South Africa
-
 Spain
-
 Sri Lanka
-
 Sweden
-
 Switzerland
-
 Syria
-
 Taiwan
-
 Tajikistan
-
 Tanzania
-
 Thailand
-
 Trinidad and Tobago
-
 Tunisia
-
 Turkey
-
 UAE
-
 Uganda
-
 Ukraine
-
 United Kingdom
-
United States
-
 Uruguay
-
 Uzbekistan
-
 Venezuela
-
 Vietnam
-
 Yemen
-
 Zambia
-
 Zimbabwe
- Forex
- Crypto












