

Peloton shares technical analysis: Resistance test at $5.76 limits immediate upside

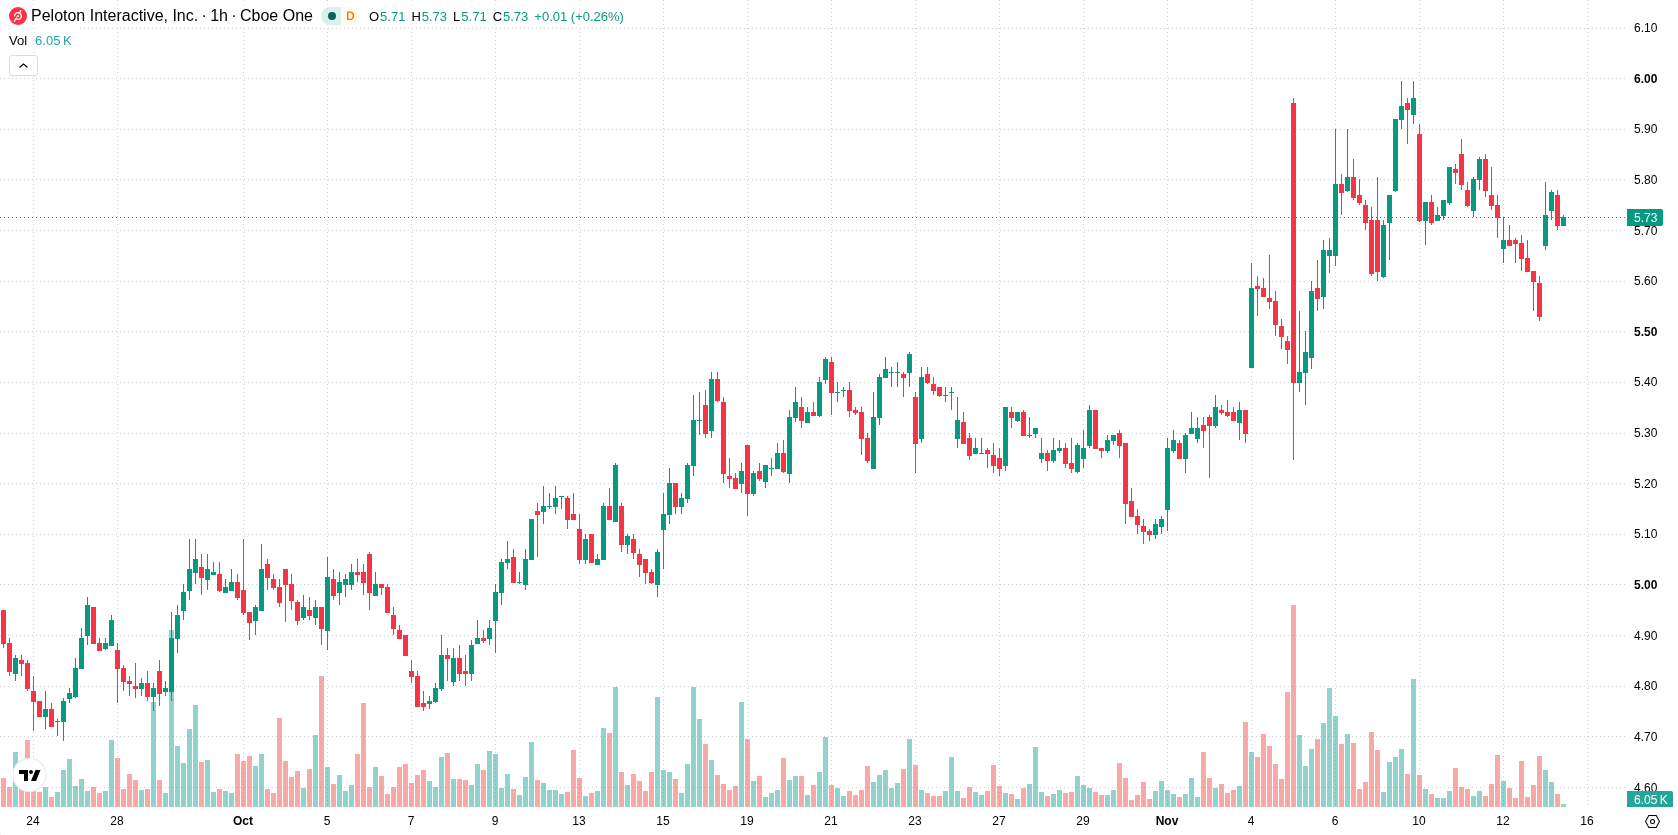
Peloton (PTON) stock is trading at $5.73, advancing 3.71% on the session and ending near the upper boundary of today’s range. The share price is positioned above its short- and medium-term moving averages, further extending the gap versus long-term trend levels.
 5.79
6.00
Highlights
- Peloton raised $600 million through a private bond sale of senior secured notes due 2032, improving its liquidity and enabling debt refinancing.
- A new $200 million credit line further strengthens Peloton's access to capital for corporate needs and investment flexibility.
- Shares of Peloton traded at $5.73, with current price action near resistance at $5.76 and expected to range between $5.52 to $5.94, as mixed technical signals suggest potential for a near-term move higher.
Liquidity gains as bond sale and credit line bolster capital position
Peloton Interactive completed a $600 million private bond offering of senior secured notes due 2032, a move that enhances its liquidity position and provides capital for refinancing existing debt, according to Globenewswire. This step strengthens the company’s financial stability and operational flexibility, helping to reduce near-term refinancing risk. In addition, Peloton secured a new $200 million credit line for broader corporate uses, further supporting its access to capital resources. Together, these developments improve Peloton’s ability to navigate strategic investments or potential buyback opportunities.
Mixed momentum as resistance and oversold signals shape near-term bias
On the technical side, PTON trades above the MA-20 at $5.72 and the MA-50 at $5.68 on the working timeframe, and also remains well above the MA-200 at $5.2 on the daily chart. The Ichimoku Kijun line at $5.76 is currently acting as immediate resistance. Momentum indicators are mixed: MACD and ADX continue to point to a sell bias, while sellers currently dominate intraday movement as measured by Bull/Bear Power at –0.06. The RSI reading is neutral, whereas Stochastic RSI and CCI are both in oversold territory, indicating potential for a technical bounce, but without confirming a reversal. The Awesome Oscillator also gives a sell signal, suggesting short-term downside pressure remains present.
Sideways trade favored as breakout hinges on resistance and support
Looking ahead to the next several trading days, PTON is expected to remain within a price range of $5.52 to $5.94, which represents the typical volatility band relative to recent market action. Probability analysis points to a higher chance of an upward breakout at 74%, with a less likely downside move of 26%. The baseline scenario envisions continued sideways trading in this band. A bullish outcome would be triggered by a break above resistance at $5.76, whereas a move below support near $5.52 would open up the risk for further declines.
Previously it was reported that Peloton’s ongoing debt restructuring efforts had improved its liquidity and reduced near-term refinancing risk, though near-term technical pressure persisted. The current analysis adds further evidence of financial reinforcement through new capital measures, highlighting resistance at $5.76 as the key level for traders to monitor for signs of a sustained upward breakout.






Latest Peloton Interactive News




-
 Afghanistan
-
 Albania
-
 Algeria
-
 Angola
-
 Argentina
-
 Armenia
-
 Australia
-
 Austria
-
 Azerbaijan
-
 Bahamas
-
 Bahrain
-
 Bangladesh
-
 Belarus
-
 Belgium
-
 Bolivia
-
 Botswana
-
 Brazil
-
 Brunei
-
 Bulgaria
-
 Cambodia
-
 Cameroon
-
 Canada
-
 Chile
-
 China
-
 Colombia
-
 Congo
-
 Costa Rica
-
 Cote d'Ivoire
-
 Croatia
-
 Cuba
-
 Cyprus
-
 Czechia
-
 DR Congo
-
 Denmark
-
 Dominican Republic
-
 Ecuador
-
 Egypt
-
 El Salvador
-
 Estonia
-
 Eswatini
-
 Ethiopia
-
 Finland
-
 France
-
 Georgia
-
 Germany
-
 Ghana
-
 Greece
-
 Haiti
-
 Hong Kong
-
 Hungary
-
 India
-
 Indonesia
-
 Iran, Islamic republic
-
 Iraq
-
 Ireland
-
 Israel
-
 Italy
-
 Jamaica
-
 Japan
-
 Jordan
-
 Kazakhstan
-
 Kenya
-
 Korea
-
 Kuwait
-
 Kyrgyzstan
-
 Laos
-
 Latvia
-
 Lebanon
-
 Lesotho
-
 Libya
-
 Lithuania
-
 Luxembourg
-
 Madagascar
-
 Malaysia
-
 Malta
-
 Mauritius
-
 Mexico
-
 Moldova
-
 Mongolia
-
 Montenegro
-
 Morocco
-
 Mozambique
-
 Myanmar
-
 Namibia
-
 Nepal
-
 Netherlands
-
 New Zealand
-
 Nigeria
-
 North Macedonia
-
 Norway
-
 Oman
-
 Pakistan
-
 Palestine
-
 Panama
-
 Papua New Guinea
-
 Paraguay
-
 Peru
-
 Philippines
-
 Poland
-
 Portugal
-
 Puerto Rico
-
 Qatar
-
 Reunion
-
 Romania
-
 Rwanda
-
 Saudi Arabia
-
 Serbia
-
 Singapore
-
 Slovakia
-
 Slovenia
-
 Somalia
-
 South Africa
-
 Spain
-
 Sri Lanka
-
 Sweden
-
 Switzerland
-
 Syria
-
 Taiwan
-
 Tajikistan
-
 Tanzania
-
 Thailand
-
 Trinidad and Tobago
-
 Tunisia
-
 Turkey
-
 UAE
-
 Uganda
-
 Ukraine
-
 United Kingdom
-
United States
-
 Uruguay
-
 Uzbekistan
-
 Venezuela
-
 Vietnam
-
 Yemen
-
 Zambia
-
 Zimbabwe
- Forex
- Crypto












