

Applied Materials shares technical analysis: Downward price move dominates current trend

Applied Materials (AMAT) stock is trading at $362.66 after falling 4.8% on the day. The stock currently sits below its key short- and long-term moving averages, reflecting ongoing selling pressure.
 381.37
404.40
Highlights
- Applied Materials reported record quarterly revenue of $10.41 billion, up 53% year over year, and adjusted earnings per share of $4.16, a 92% increase.
- The company returned $2.42 billion to shareholders through its largest share repurchase in more than eight years and dividends.
- Shares of Applied Materials fell 4.8% to $362.66, trading below key moving averages with a projected range of $335.58 to $389.74 and intraday seller dominance.
Surging revenue and buybacks countered by sustained equity outflows
Applied Materials reported record fiscal fourth quarter revenue of $10.41 billion, a 53% increase year-over-year, reflecting surging demand for its semiconductor equipment driven by AI developments. The company posted adjusted earnings per share of $4.16, up 92% from the prior year, and returned $2.42 billion to shareholders through share repurchases and dividends. Notably, this share repurchase was its largest in more than eight years, according to Globenewswire, highlighting the scale of recent capital returns—though price action has remained under broader selling pressure.
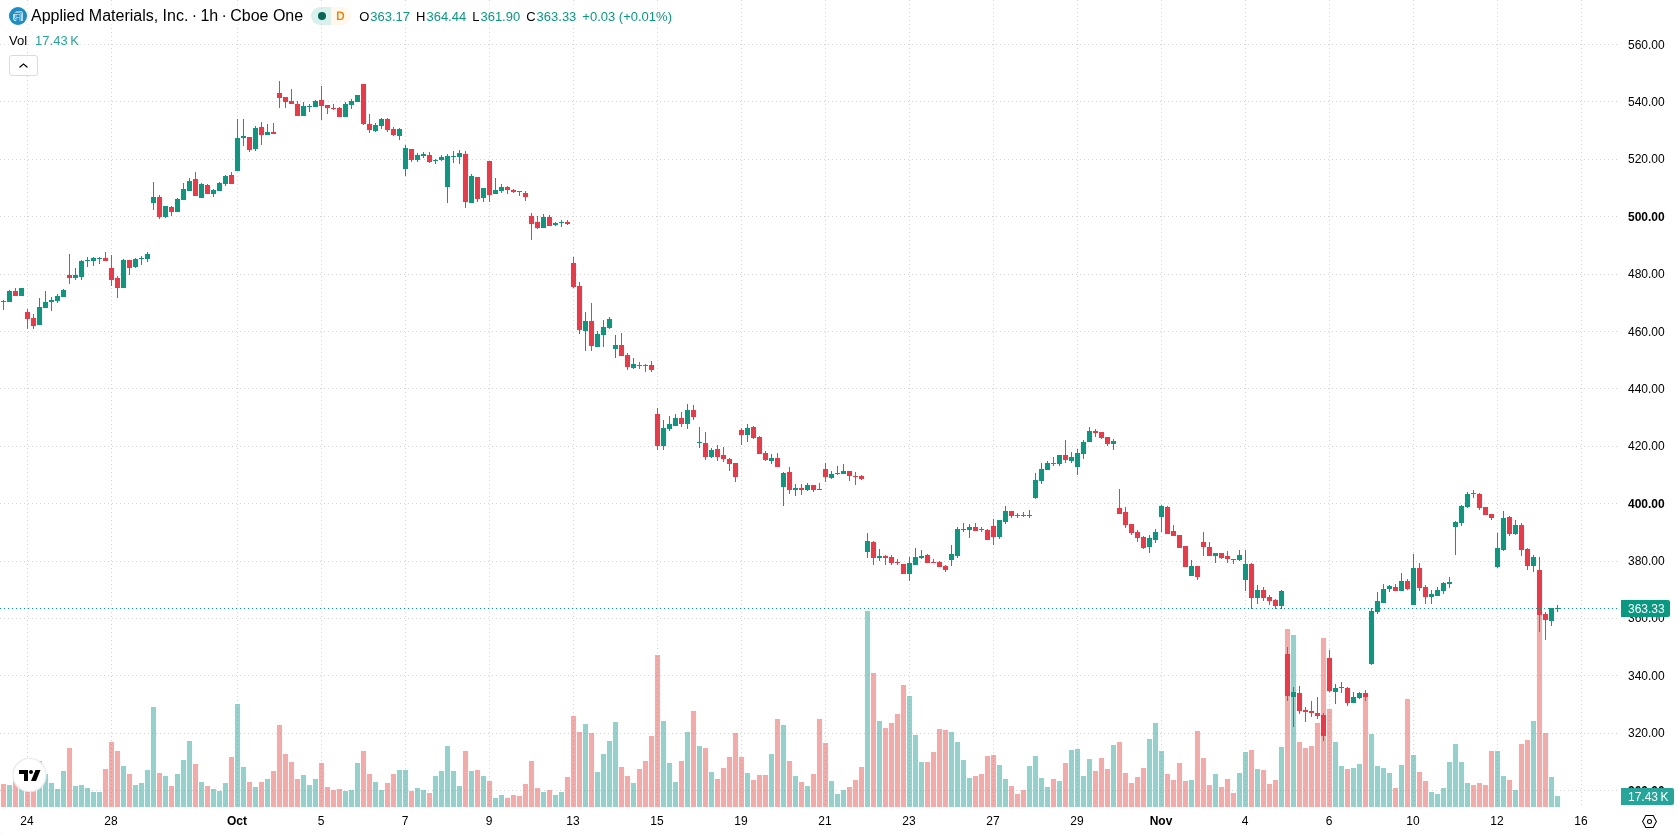
Resistance caps price as momentum mixed, sellers keep advantage
AMAT is trading below the MA-20 and MA-50 on the H1 chart, with the MA-200 also overhead as a long-term barrier. The Ichimoku Kijun at $384.6 marks immediate resistance. Momentum signals are mixed: MACD signals a strong buy, while ADX indicates a sell bias. Both RSI and CCI are neutral, while Stochastic RSI is in the oversold zone, suggesting rebound potential but not yet confirming a trend reversal. Bull/Bear Power remains negative, pointing to continued intraday seller dominance, and the Awesome Oscillator is neutral.
Downside risk prevails as volatility range holds near term
In the next two to three trading days, AMAT is expected to fluctuate within a volatility band of $335.58 to $389.74. There is a 38% probability of an upward move, with a higher chance of downside given current market momentum. Price is likely to oscillate within this range unless a breakout over resistance or breakdown below support occurs.
Earlier, analysts noted that Applied Materials remained under selling pressure and was vulnerable to further downside despite solid financial results. The latest price action and technical signals reinforce this cautious outlook, making the $384.6 resistance level pivotal for any sustained rebound in the near term.






Latest Applied Materials News





-
 Afghanistan
-
 Albania
-
 Algeria
-
 Angola
-
 Argentina
-
 Armenia
-
 Australia
-
 Austria
-
 Azerbaijan
-
 Bahamas
-
 Bahrain
-
 Bangladesh
-
 Belarus
-
 Belgium
-
 Bolivia
-
 Botswana
-
 Brazil
-
 Brunei
-
 Bulgaria
-
 Cambodia
-
 Cameroon
-
 Canada
-
 Chile
-
 China
-
 Colombia
-
 Congo
-
 Costa Rica
-
 Cote d'Ivoire
-
 Croatia
-
 Cuba
-
 Cyprus
-
 Czechia
-
 DR Congo
-
 Denmark
-
 Dominican Republic
-
 Ecuador
-
 Egypt
-
 El Salvador
-
 Estonia
-
 Eswatini
-
 Ethiopia
-
 Finland
-
 France
-
 Georgia
-
 Germany
-
 Ghana
-
 Greece
-
 Haiti
-
 Hong Kong
-
 Hungary
-
 India
-
 Indonesia
-
 Iran, Islamic republic
-
 Iraq
-
 Ireland
-
 Israel
-
 Italy
-
 Jamaica
-
 Japan
-
 Jordan
-
 Kazakhstan
-
 Kenya
-
 Korea
-
 Kuwait
-
 Kyrgyzstan
-
 Laos
-
 Latvia
-
 Lebanon
-
 Lesotho
-
 Libya
-
 Lithuania
-
 Luxembourg
-
 Madagascar
-
 Malaysia
-
 Malta
-
 Mauritius
-
 Mexico
-
 Moldova
-
 Mongolia
-
 Montenegro
-
 Morocco
-
 Mozambique
-
 Myanmar
-
 Namibia
-
 Nepal
-
 Netherlands
-
 New Zealand
-
 Nigeria
-
 North Macedonia
-
 Norway
-
 Oman
-
 Pakistan
-
 Palestine
-
 Panama
-
 Papua New Guinea
-
 Paraguay
-
 Peru
-
 Philippines
-
 Poland
-
 Portugal
-
 Puerto Rico
-
 Qatar
-
 Reunion
-
 Romania
-
 Rwanda
-
 Saudi Arabia
-
 Serbia
-
 Singapore
-
 Slovakia
-
 Slovenia
-
 Somalia
-
 South Africa
-
 Spain
-
 Sri Lanka
-
 Sweden
-
 Switzerland
-
 Syria
-
 Taiwan
-
 Tajikistan
-
 Tanzania
-
 Thailand
-
 Trinidad and Tobago
-
 Tunisia
-
 Turkey
-
 UAE
-
 Uganda
-
 Ukraine
-
 United Kingdom
-
United States
-
 Uruguay
-
 Uzbekistan
-
 Venezuela
-
 Vietnam
-
 Yemen
-
 Zambia
-
 Zimbabwe
- Forex
- Crypto












