

Roblox stock extends downward move as weak momentum persists

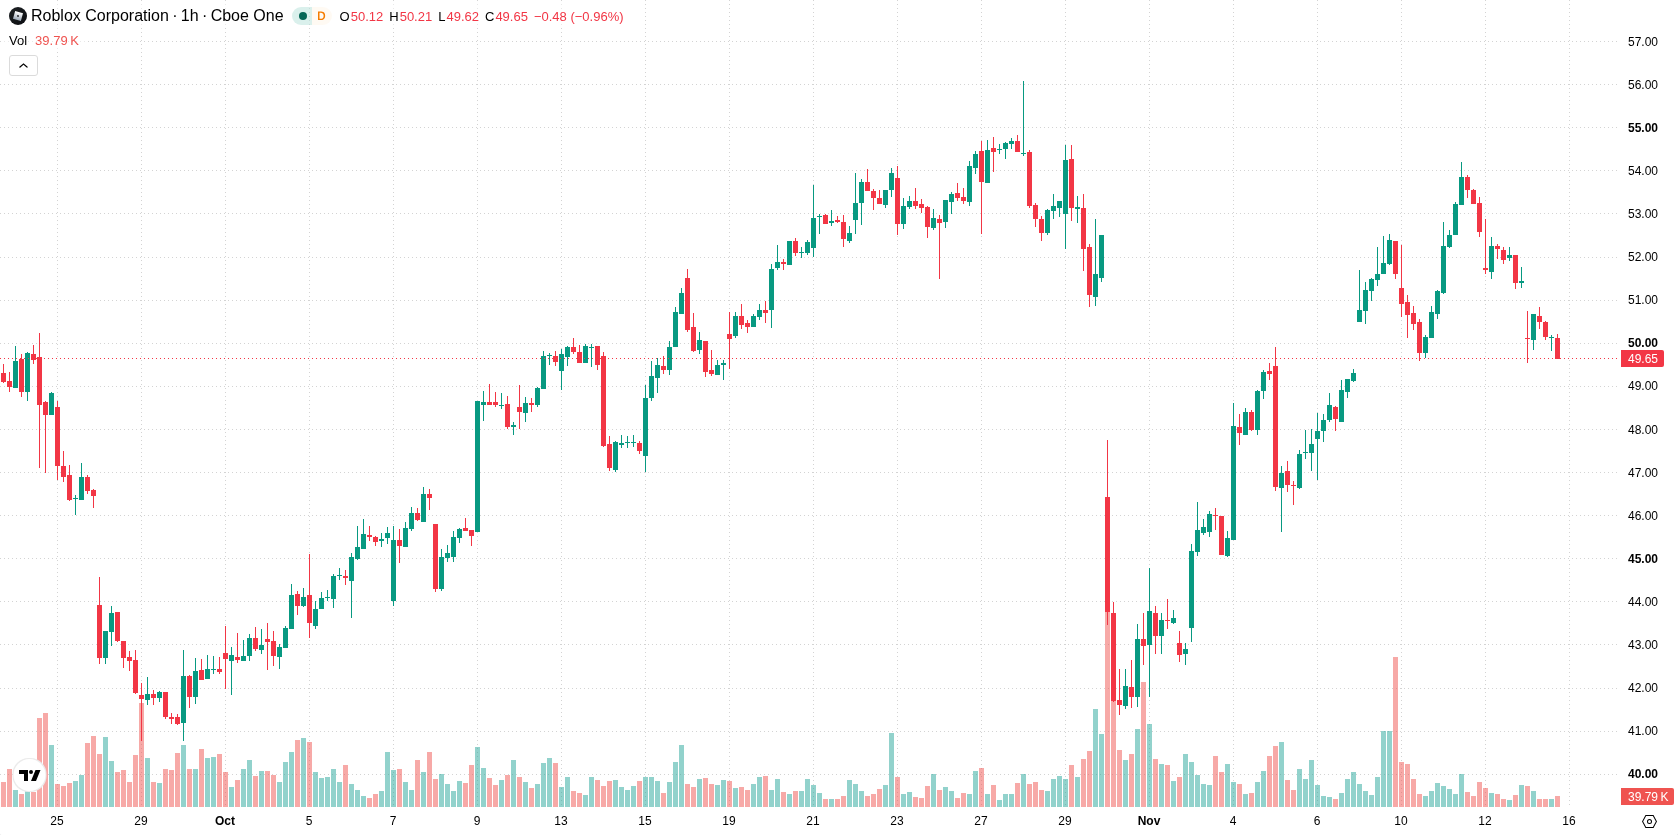
Roblox (RBLX) stock is trading at $49.71, down 3.29% on the day. The price is positioned below its key moving averages, highlighting ongoing short-term and longer-term selling pressure.
 50.85
54.15
Highlights
- Shares of Roblox fell 3.29% to $49.71, trading near the session low on low volatility.
- The stock faces persistent downward pressure across short, medium, and long-term technical indicators.
- Expected trading range for the next few sessions is $47.66 to $51.76, with a 57% probability of a downside move.
Resistance at $51.88 and mixed momentum shape technical outlook
On the technical front, RBLX is trading below the MA-20, MA-50, and MA-200, illustrating that sellers control the trend across short, medium, and long horizons. The Ichimoku Kijun level at $51.88 stands as the immediate resistance. Momentum signals are mixed: while MACD issues a Strong Buy signal, the ADX confirms ongoing seller dominance. Oscillators present a neutral stance with both RSI and CCI showing neutral readings, but Stoch RSI has entered oversold territory, suggesting possible selling exhaustion. Bull/Bear Power is negative, indicating intraday seller strength, and the Awesome Oscillator maintains a neutral read.
Downside favored as trading range narrows and resistance holds
Over the coming days, the expected trading range is $47.66 to $51.76, reflecting a typical volatility band relative to current levels. Downside continuation holds a higher probability at 57%, with a 43% chance of an upward move. The baseline scenario sees the price consolidating within this band, while any bullish breakout would require a clear move above resistance at $51.88. Should support at $47.66 fail, a deeper bearish scenario could develop.
Previously it was reported that Roblox was displaying technical resilience with the potential for sideways trading within defined volatility bands. The current decline below key moving averages signals a shift toward sustained selling pressure, making the $51.88 resistance a critical level to monitor for any potential reversal.










-
 Afghanistan
-
 Albania
-
 Algeria
-
 Angola
-
 Argentina
-
 Armenia
-
 Australia
-
 Austria
-
 Azerbaijan
-
 Bahamas
-
 Bahrain
-
 Bangladesh
-
 Belarus
-
 Belgium
-
 Bolivia
-
 Botswana
-
 Brazil
-
 Brunei
-
 Bulgaria
-
 Cambodia
-
 Cameroon
-
 Canada
-
 Chile
-
 China
-
 Colombia
-
 Congo
-
 Costa Rica
-
 Cote d'Ivoire
-
 Croatia
-
 Cuba
-
 Cyprus
-
 Czechia
-
 DR Congo
-
 Denmark
-
 Dominican Republic
-
 Ecuador
-
 Egypt
-
 El Salvador
-
 Estonia
-
 Eswatini
-
 Ethiopia
-
 Finland
-
 France
-
 Georgia
-
 Germany
-
 Ghana
-
 Greece
-
 Haiti
-
 Hong Kong
-
 Hungary
-
 India
-
 Indonesia
-
 Iran, Islamic republic
-
 Iraq
-
 Ireland
-
 Israel
-
 Italy
-
 Jamaica
-
 Japan
-
 Jordan
-
 Kazakhstan
-
 Kenya
-
 Korea
-
 Kuwait
-
 Kyrgyzstan
-
 Laos
-
 Latvia
-
 Lebanon
-
 Lesotho
-
 Libya
-
 Lithuania
-
 Luxembourg
-
 Madagascar
-
 Malaysia
-
 Malta
-
 Mauritius
-
 Mexico
-
 Moldova
-
 Mongolia
-
 Montenegro
-
 Morocco
-
 Mozambique
-
 Myanmar
-
 Namibia
-
 Nepal
-
 Netherlands
-
 New Zealand
-
 Nigeria
-
 North Macedonia
-
 Norway
-
 Oman
-
 Pakistan
-
 Palestine
-
 Panama
-
 Papua New Guinea
-
 Paraguay
-
 Peru
-
 Philippines
-
 Poland
-
 Portugal
-
 Puerto Rico
-
 Qatar
-
 Reunion
-
 Romania
-
 Rwanda
-
 Saudi Arabia
-
 Serbia
-
 Singapore
-
 Slovakia
-
 Slovenia
-
 Somalia
-
 South Africa
-
 Spain
-
 Sri Lanka
-
 Sweden
-
 Switzerland
-
 Syria
-
 Taiwan
-
 Tajikistan
-
 Tanzania
-
 Thailand
-
 Trinidad and Tobago
-
 Tunisia
-
 Turkey
-
 UAE
-
 Uganda
-
 Ukraine
-
 United Kingdom
-
United States
-
 Uruguay
-
 Uzbekistan
-
 Venezuela
-
 Vietnam
-
 Yemen
-
 Zambia
-
 Zimbabwe
- Forex
- Crypto












