

BROS climbs as upward price move draws strong buyer interest

Dutch Bros Inc. (BROS) stock is trading at $35.9, marking a 6.5% increase over the prior session. The price currently sits above its key short- and medium-term moving averages.
 36.00
36.52
Highlights
- Dutch Bros stock reported quarterly earnings per share of $0.25, narrowly exceeding the $0.24 consensus estimate.
- Quarterly revenue reached $549.84 million, surpassing expectations and supporting business momentum in the current period.
- Shares closed with a 6.5% intraday gain near the high, but technical indicators show mixed momentum and forecast a $34.52 to $37.28 trading range.
Earnings outperformance and revenue beat fuel renewed buying interest
Dutch Bros Inc. reported quarterly earnings on November 4th with earnings per share of $0.25, narrowly surpassing the consensus estimate of $0.24. This outperformance has reinforced market optimism around the company's earnings power, encouraging increased buying interest in the stock. Additionally, the firm posted revenue of $549.84 million for the quarter—slightly ahead of analyst expectations at $548.27 million—further supporting confidence in ongoing business momentum.
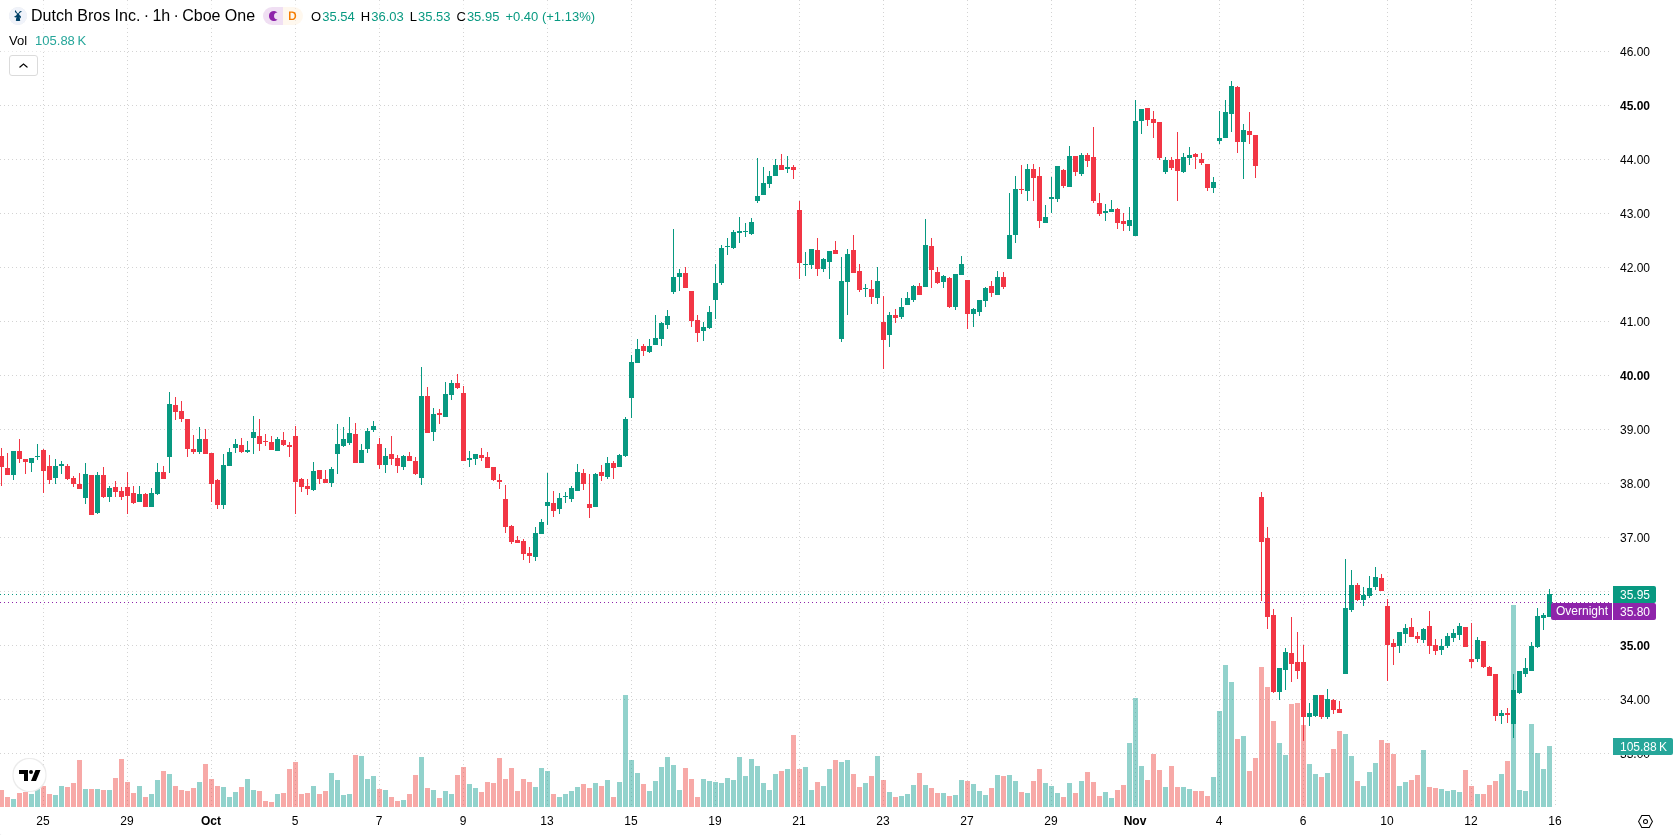
Buyer strength persists as overbought signals and mixed momentum emerge
On the hourly chart, BROS/USD is trading above the MA-20 at $34.79 and MA-50 at $35.1, with the long-term MA-200 positioned much higher at $52.24. The Ichimoku Kijun sits at $34.64, providing near-term support. Among momentum indicators, MACD is showing a Strong Sell signal and ADX is Neutral. RSI remains neutral, but Stoch RSI and CCI are both in overbought territory, which reflects localized overheating. Bull/Bear Power registers a positive 1.03, indicating prevailing buyer strength, while the Awesome Oscillator aligns with the current bullish swing. The modest negative gap of -0.28 was not a barrier to the strong price action seen in the latest session. However, mixed oscillator readings counterbalance the otherwise bullish momentum.
Range trading likely as breakout risks hinge on resistance and momentum
Looking ahead over the next several sessions, BROS is expected to fluctuate within a range of $34.52 to $37.28, consistent with recent volatility. The probability of a short-term upward breakout stands at 43%, which implies a slightly higher chance of a downward move given current technical signals. The baseline expectation is for price consolidation inside this range. However, a clear bullish scenario would involve breaking above the $37.28 resistance, while a bearish outcome would materialize if the price falls below $34.52 and buyers fail to defend overheated momentum.
Earlier, analysts noted that Dutch Bros remained under sustained bearish pressure, with technical indicators highlighting prevailing downside risks. The current technical setup points to a pivotal moment, with sustained consolidation above $35.1 potentially setting the stage for a test of the $37.28 resistance in the sessions ahead.













-
 Afghanistan
-
 Albania
-
 Algeria
-
 Angola
-
 Argentina
-
 Armenia
-
 Australia
-
 Austria
-
 Azerbaijan
-
 Bahamas
-
 Bahrain
-
 Bangladesh
-
 Belarus
-
 Belgium
-
 Bolivia
-
 Botswana
-
 Brazil
-
 Brunei
-
 Bulgaria
-
 Cambodia
-
 Cameroon
-
 Canada
-
 Chile
-
 China
-
 Colombia
-
 Congo
-
 Costa Rica
-
 Cote d'Ivoire
-
 Croatia
-
 Cuba
-
 Cyprus
-
 Czechia
-
 DR Congo
-
 Denmark
-
 Dominican Republic
-
 Ecuador
-
 Egypt
-
 El Salvador
-
 Estonia
-
 Eswatini
-
 Ethiopia
-
 Finland
-
 France
-
 Georgia
-
 Germany
-
 Ghana
-
 Greece
-
 Haiti
-
 Hong Kong
-
 Hungary
-
 India
-
 Indonesia
-
 Iran, Islamic republic
-
 Iraq
-
 Ireland
-
 Israel
-
 Italy
-
 Jamaica
-
 Japan
-
 Jordan
-
 Kazakhstan
-
 Kenya
-
 Korea
-
 Kuwait
-
 Kyrgyzstan
-
 Laos
-
 Latvia
-
 Lebanon
-
 Lesotho
-
 Libya
-
 Lithuania
-
 Luxembourg
-
 Madagascar
-
 Malaysia
-
 Malta
-
 Mauritius
-
 Mexico
-
 Moldova
-
 Mongolia
-
 Montenegro
-
 Morocco
-
 Mozambique
-
 Myanmar
-
 Namibia
-
 Nepal
-
 Netherlands
-
 New Zealand
-
 Nigeria
-
 North Macedonia
-
 Norway
-
 Oman
-
 Pakistan
-
 Palestine
-
 Panama
-
 Papua New Guinea
-
 Paraguay
-
 Peru
-
 Philippines
-
 Poland
-
 Portugal
-
 Puerto Rico
-
 Qatar
-
 Reunion
-
 Romania
-
 Rwanda
-
 Saudi Arabia
-
 Serbia
-
 Singapore
-
 Slovakia
-
 Slovenia
-
 Somalia
-
 South Africa
-
 Spain
-
 Sri Lanka
-
 Sweden
-
 Switzerland
-
 Syria
-
 Taiwan
-
 Tajikistan
-
 Tanzania
-
 Thailand
-
 Trinidad and Tobago
-
 Tunisia
-
 Turkey
-
 UAE
-
 Uganda
-
 Ukraine
-
 United Kingdom
-
United States
-
 Uruguay
-
 Uzbekistan
-
 Venezuela
-
 Vietnam
-
 Yemen
-
 Zambia
-
 Zimbabwe
- Forex
- Crypto












