

HSBC holds steady amid subdued momentum and recent capital management actions

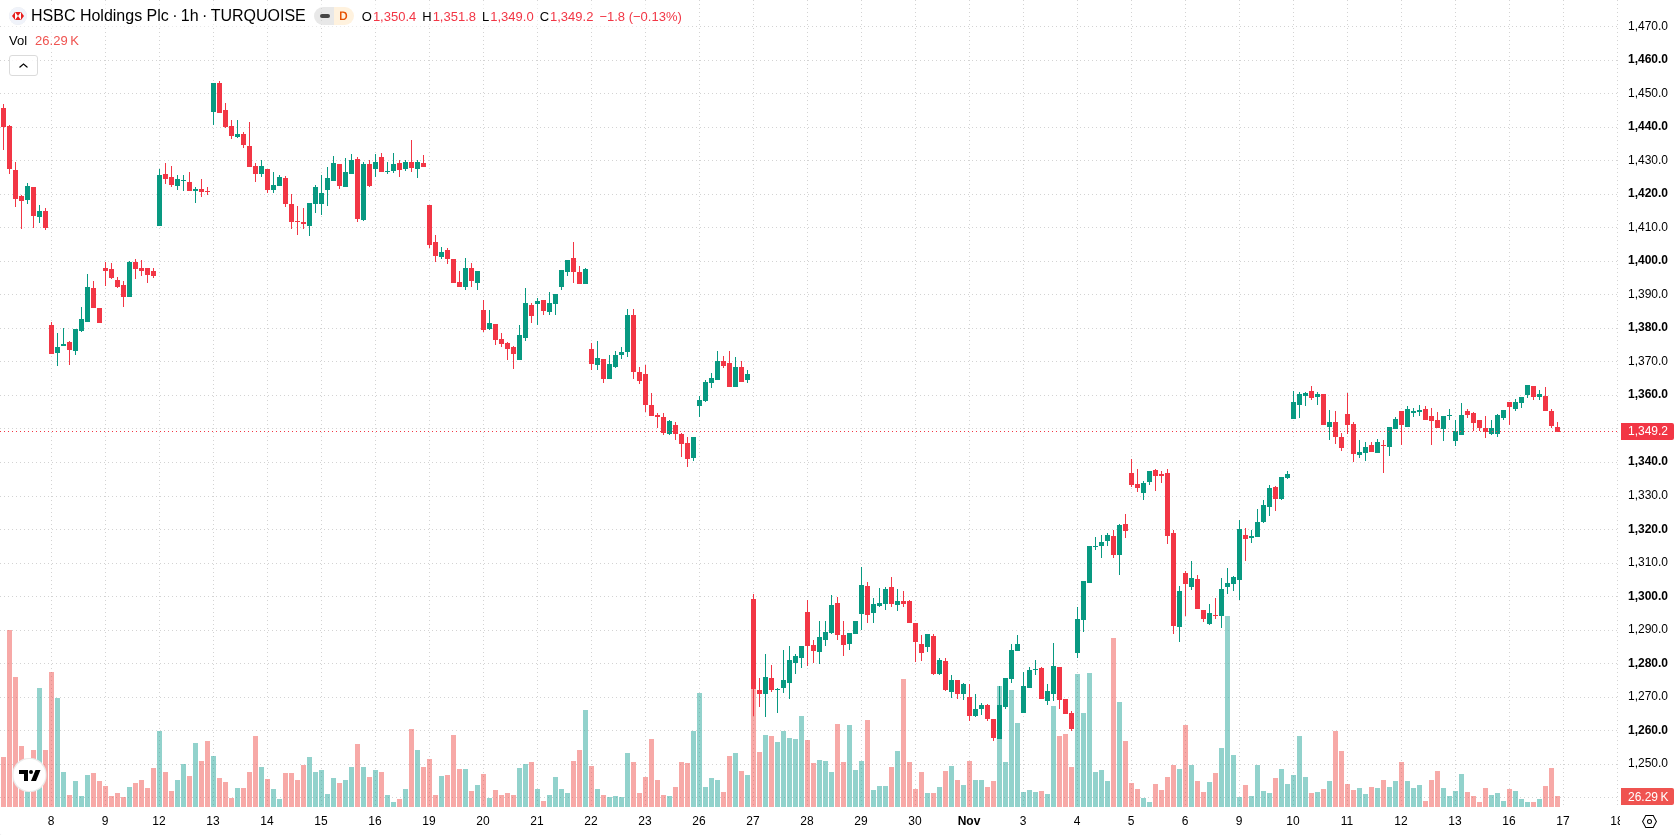
HSBC (HSBA.L) stock is trading at GBX1,349, showing a modest decline for the session. The price remains below its key moving averages, which suggests subdued momentum at present.
 1359.80
1362.80
Highlights
- HSBC completed repurchases totaling 12,019,061 shares since October 28, 2026, for approximately $210.7 million, shrinking outstanding float.
- HSBC sold a $300 million portion of a loan linked to a distressed New Mexico data center project at a significant discount, reducing credit risk exposure.
- Shares of HSBC trade below key moving averages with selling dominating intraday and an expected range of GBX1,337 to GBX1,361 over the next few days.
Share buybacks support valuation as loan sale cuts credit exposure
HSBC completed a repurchase and cancellation of 1,010,000 ordinary shares on November 16, 2026, raising its total buybacks since October 28, 2026, to 12,019,061 shares for approximately US$210.7 million, according to Investegate Co. This active capital management reduces the outstanding share float, which can enhance per-share metrics and is typically viewed as supportive for long-term valuation. Separately, Bloomberg reported that HSBC also sold a $300 million portion of a loan tied to a troubled New Mexico data center project at a steep discount, a move that lowers credit risk exposure but may reflect challenges in the sector.
Seller dominance persists as mixed momentum clouds immediate direction
HSBC (HSBA.L) is trading below the H1 SMA-20 at GBX1,354, the H1 SMA-50 at GBX1,350, and the D1 SMA-200 at GBX1,392. The Ichimoku Kijun is at GBX1,353, acting as immediate resistance. MACD delivers a strong buy signal, while ADX is neutral. RSI and CCI remain in neutral zones, and the Stochastic RSI is in the oversold zone, indicating potential for selling exhaustion. Bull/Bear Power is negative intraday, pointing to prevailing seller dominance. The Awesome Oscillator maintains a neutral stance.
Sideways trading favored as breakout chances remain limited
Over the next several sessions, HSBC (HSBA.L) is expected to trade within a GBX1,337 to GBX1,361 volatility band relative to current levels. The likelihood of an upward move is estimated at 45%, leaving a slightly higher probability for a downside scenario. The base case calls for continued sideways movement within this range, with a potential upside if resistance is cleared and a bearish extension possible if support fails.
Previously it was reported that HSBC sold a portion of its debt exposure tied to a New Mexico data center at a discount, highlighting a cautious approach toward riskier AI infrastructure financing. This development, alongside subdued technical momentum and ongoing share buybacks, underscores the importance of monitoring the GBX1,337 support level, as a bearish break below it could signal further downside in the near term.










-
 Afghanistan
-
 Albania
-
 Algeria
-
 Angola
-
 Argentina
-
 Armenia
-
 Australia
-
 Austria
-
 Azerbaijan
-
 Bahamas
-
 Bahrain
-
 Bangladesh
-
 Belarus
-
 Belgium
-
 Bolivia
-
 Botswana
-
 Brazil
-
 Brunei
-
 Bulgaria
-
 Cambodia
-
 Cameroon
-
 Canada
-
 Chile
-
 China
-
 Colombia
-
 Congo
-
 Costa Rica
-
 Cote d'Ivoire
-
 Croatia
-
 Cuba
-
 Cyprus
-
 Czechia
-
 DR Congo
-
 Denmark
-
 Dominican Republic
-
 Ecuador
-
 Egypt
-
 El Salvador
-
 Estonia
-
 Eswatini
-
 Ethiopia
-
 Finland
-
 France
-
 Georgia
-
 Germany
-
 Ghana
-
 Greece
-
 Haiti
-
 Hong Kong
-
 Hungary
-
 India
-
 Indonesia
-
 Iran, Islamic republic
-
 Iraq
-
 Ireland
-
 Israel
-
 Italy
-
 Jamaica
-
 Japan
-
 Jordan
-
 Kazakhstan
-
 Kenya
-
 Korea
-
 Kuwait
-
 Kyrgyzstan
-
 Laos
-
 Latvia
-
 Lebanon
-
 Lesotho
-
 Libya
-
 Lithuania
-
 Luxembourg
-
 Madagascar
-
 Malaysia
-
 Malta
-
 Mauritius
-
 Mexico
-
 Moldova
-
 Mongolia
-
 Montenegro
-
 Morocco
-
 Mozambique
-
 Myanmar
-
 Namibia
-
 Nepal
-
 Netherlands
-
 New Zealand
-
 Nigeria
-
 North Macedonia
-
 Norway
-
 Oman
-
 Pakistan
-
 Palestine
-
 Panama
-
 Papua New Guinea
-
 Paraguay
-
 Peru
-
 Philippines
-
 Poland
-
 Portugal
-
 Puerto Rico
-
 Qatar
-
 Reunion
-
 Romania
-
 Rwanda
-
 Saudi Arabia
-
 Serbia
-
 Singapore
-
 Slovakia
-
 Slovenia
-
 Somalia
-
 South Africa
-
 Spain
-
 Sri Lanka
-
 Sweden
-
 Switzerland
-
 Syria
-
 Taiwan
-
 Tajikistan
-
 Tanzania
-
 Thailand
-
 Trinidad and Tobago
-
 Tunisia
-
 Turkey
-
 UAE
-
 Uganda
-
 Ukraine
-
 United Kingdom
-
United States
-
 Uruguay
-
 Uzbekistan
-
 Venezuela
-
 Vietnam
-
 Yemen
-
 Zambia
-
 Zimbabwe
- Forex
- Crypto












