

GSK shares drop about 1.5% after solid quarter is met with technical resistance

GSK plc (GSK) fell 1.5% as selling pressure emerged, even as solid third-quarter earnings and strong cash flow results provided a positive fundamental backdrop. The weakness is reinforced by the share price staying below its 200-day moving average, highlighting persistent longer-term resistance.
 1916.50
1949.68
Highlights
- GSK recorded strong third-quarter results, with operating cash flow up £1.1 billion and free cash flow up £1.8 billion year over year.
- The company reaffirmed its 2026 outlook, announced a 17 pence third-quarter dividend, and reported ongoing workforce reductions and vaccine manufacturing consolidation.
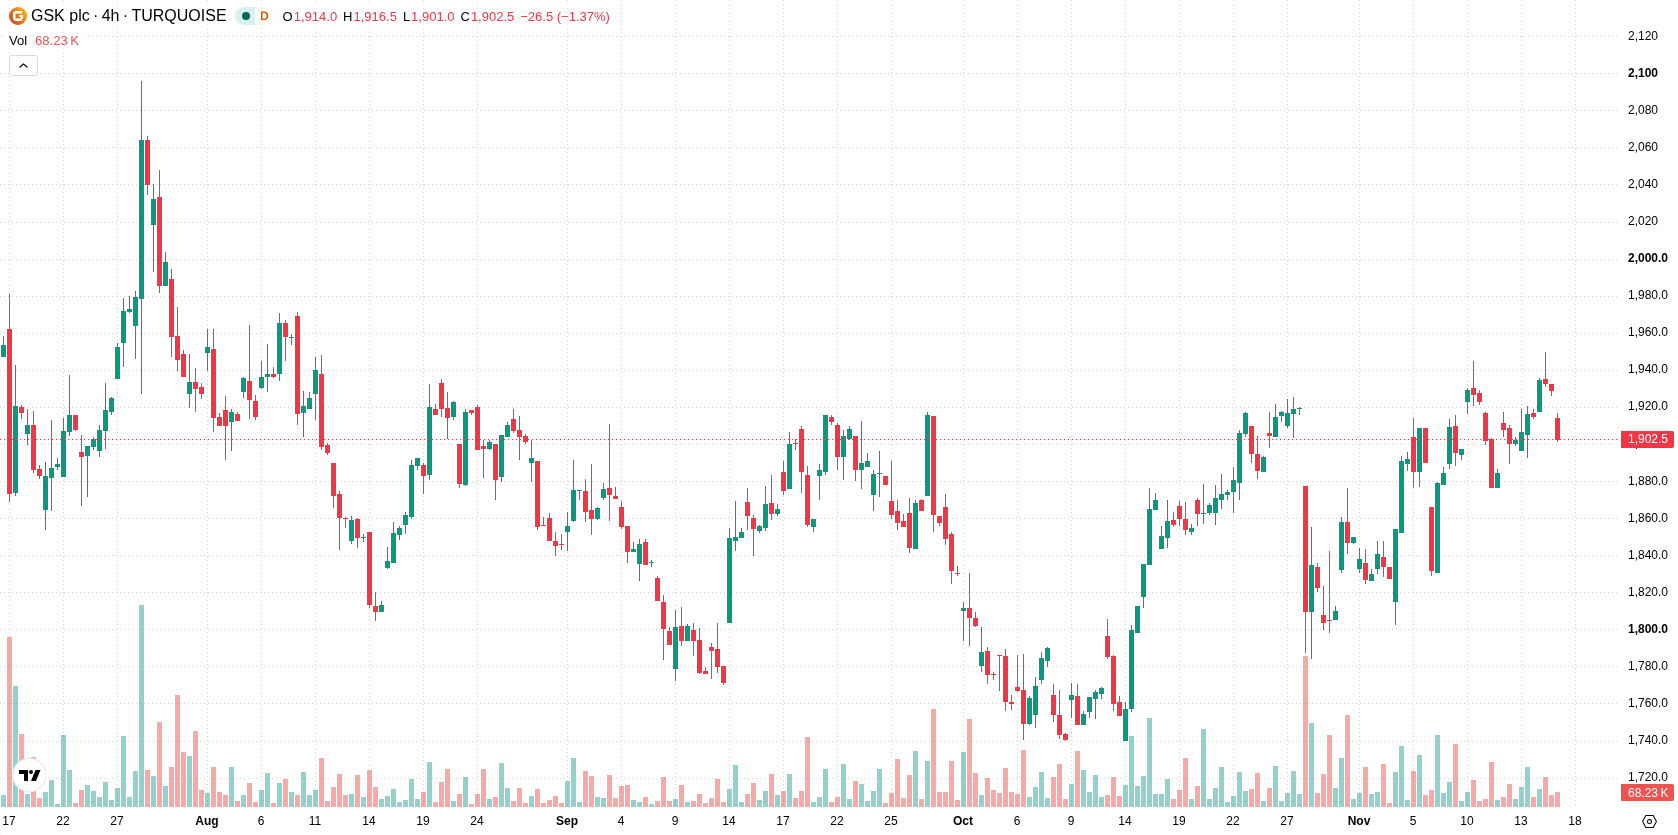
- Shares of GSK trade above near-term support but below longer-term resistance, with technical signals mixed and a five-day price range projected at GBX1,863 to GBX1,937.
Dividends and cost cuts bolster outlook as stock faces selling
GSK reported strong third-quarter earnings, recording year-over-year increases in operating and free cash flow of £1.1 billion and £1.8 billion, respectively. The company declared a third-quarter dividend of 17 pence per share and reaffirmed its 2026 outlook. Strategic initiatives included continued consolidation of vaccine manufacturing and significant workforce reductions, which have lowered future cash requirements and supported shareholder returns, though price action has remained under broader selling pressure.
Mixed momentum signals as shorter-term gains clash with long-term resistance
GSK trades above its 20-day and 50-day moving averages (GBX1,882 and GBX1,848), indicating near- and medium-term support, but it remains below the 200-day moving average (GBX1,954), which reflects longer-term resistance. The near-term ceiling is GBX1,910 and the floor aligns with the 20-day average at GBX1,882. The broader long-term trend remains bearish, as shown by the 50- versus 200-day setup. Momentum signals are mixed: the MACD indicates buy momentum, while the Average Directional Index (ADX) and Relative Strength Index (RSI) are neutral. Both the Stochastic RSI and Commodity Channel Index (CCI) are in their overbought zones, indicating potential downside correction risks. Bull/Bear Power (BBP) is positive, and the Awesome Oscillator favors buyers. GSK fell to GBX1,900, with a downside gap of about 0.88% and trades near the session’s low, as intraday volatility stands at 0.34%. Early trading shows pressure after the open, in line with overbought oscillator readings and conflicting short-term momentum signals.
Earlier, analysts noted that GSK’s restructuring efforts and mixed technical signals suggested the stock was likely to enter a period of sideways consolidation with operational risks in focus. The current setup adds weight to that outlook, indicating that traders should monitor the GBX1,910 ceiling as a potential inflection point for any sustained move in the days ahead.









-
 Afghanistan
-
 Albania
-
 Algeria
-
 Angola
-
 Argentina
-
 Armenia
-
 Australia
-
 Austria
-
 Azerbaijan
-
 Bahamas
-
 Bahrain
-
 Bangladesh
-
 Belarus
-
 Belgium
-
 Bolivia
-
 Botswana
-
 Brazil
-
 Brunei
-
 Bulgaria
-
 Cambodia
-
 Cameroon
-
 Canada
-
 Chile
-
 China
-
 Colombia
-
 Congo
-
 Costa Rica
-
 Cote d'Ivoire
-
 Croatia
-
 Cuba
-
 Cyprus
-
 Czechia
-
 DR Congo
-
 Denmark
-
 Dominican Republic
-
 Ecuador
-
 Egypt
-
 El Salvador
-
 Estonia
-
 Eswatini
-
 Ethiopia
-
 Finland
-
 France
-
 Georgia
-
 Germany
-
 Ghana
-
 Greece
-
 Haiti
-
 Hong Kong
-
 Hungary
-
 India
-
 Indonesia
-
 Iran, Islamic republic
-
 Iraq
-
 Ireland
-
 Israel
-
 Italy
-
 Jamaica
-
 Japan
-
 Jordan
-
 Kazakhstan
-
 Kenya
-
 Korea
-
 Kuwait
-
 Kyrgyzstan
-
 Laos
-
 Latvia
-
 Lebanon
-
 Lesotho
-
 Libya
-
 Lithuania
-
 Luxembourg
-
 Madagascar
-
 Malaysia
-
 Malta
-
 Mauritius
-
 Mexico
-
 Moldova
-
 Mongolia
-
 Montenegro
-
 Morocco
-
 Mozambique
-
 Myanmar
-
 Namibia
-
 Nepal
-
 Netherlands
-
 New Zealand
-
 Nigeria
-
 North Macedonia
-
 Norway
-
 Oman
-
 Pakistan
-
 Palestine
-
 Panama
-
 Papua New Guinea
-
 Paraguay
-
 Peru
-
 Philippines
-
 Poland
-
 Portugal
-
 Puerto Rico
-
 Qatar
-
 Reunion
-
 Romania
-
 Rwanda
-
 Saudi Arabia
-
 Serbia
-
 Singapore
-
 Slovakia
-
 Slovenia
-
 Somalia
-
 South Africa
-
 Spain
-
 Sri Lanka
-
 Sweden
-
 Switzerland
-
 Syria
-
 Taiwan
-
 Tajikistan
-
 Tanzania
-
 Thailand
-
 Trinidad and Tobago
-
 Tunisia
-
 Turkey
-
 UAE
-
 Uganda
-
 Ukraine
-
 United Kingdom
-
United States
-
 Uruguay
-
 Uzbekistan
-
 Venezuela
-
 Vietnam
-
 Yemen
-
 Zambia
-
 Zimbabwe
- Forex
- Crypto












