

HUT rises as upward price move follows intraday seller control

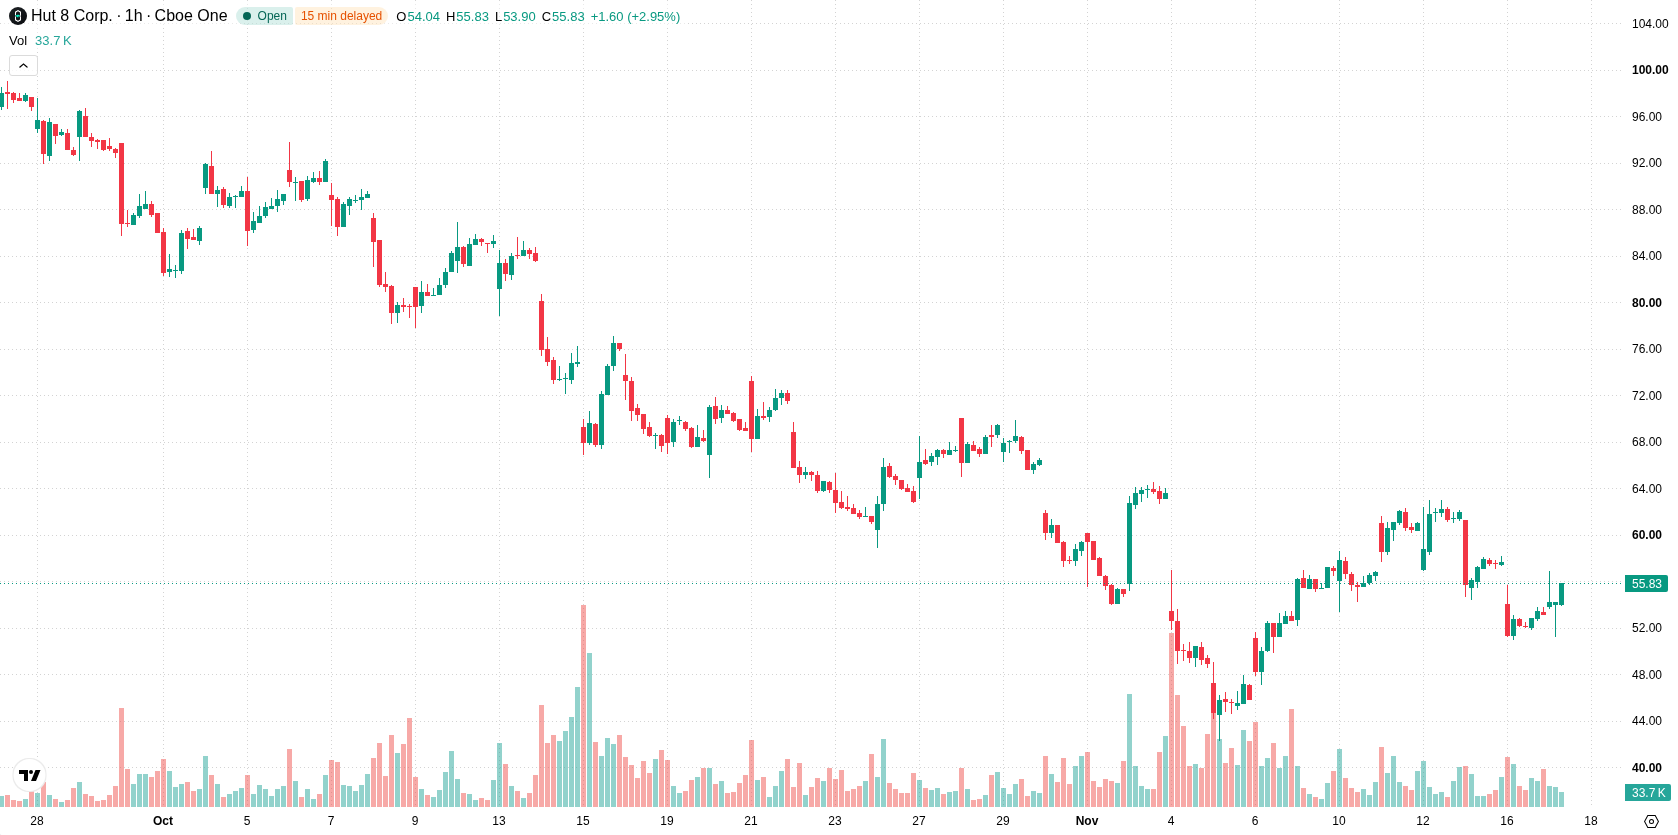
Hut 8 (HUT) stock is trading at $54.94 after advancing 3.21% for the day. The price remains below its key short-, medium-, and long-term moving averages, signaling a cautious tone in the overall trend.
 58.91
63.00
Highlights
- HUT/USD remains under short-, medium-, and long-term bearish pressure as it trades below all key moving averages.
- MACD and ADX give sell signals, while main oscillators stay neutral and sellers keep intraday dominance.
- HUT/USD is projected to trade between $49.52 and $60.36 in the next 2 to 3 days, with a 67% probability of drifting lower.
Persistent technical resistance as sell momentum outweighs neutral oscillators
HUT is trading below the H1 SMA-20 at $56.12, H1 SMA-50 at $56.58, and D1 SMA-200 at $82.33. The Ichimoku Kijun level at $56.95 serves as immediate resistance above the current price. Technical momentum is defined by Sell signals on both MACD and ADX, while all key oscillators—RSI, Stoch RSI, and CCI—remain in neutral territory. Bull/Bear Power registers at -0.34, indicating continued intraday control by sellers.
Downside risk prevails as narrow range limits immediate breakout
Over the next 2–3 trading days, HUT is projected to move within a volatility band between $49.52 and $60.36. There is a 33% chance of an upward move, while a downside scenario is favored with a 67% probability. The base case is price remaining within this established range; a breakout above $56.95 resistance could spark a recovery, while a drop below $49.52 would likely accelerate declines toward the lower end of the band.
Previously it was reported that Hut 8 continued to face prevailing bearish momentum, with institutional buying unable to offset persistent selling pressure. The current analysis reaffirms this directional bias, and traders should closely monitor $56.95 as a pivotal resistance level that could determine whether HUT remains range-bound or initiates a trend reversal.











-
 Afghanistan
-
 Albania
-
 Algeria
-
 Angola
-
 Argentina
-
 Armenia
-
 Australia
-
 Austria
-
 Azerbaijan
-
 Bahamas
-
 Bahrain
-
 Bangladesh
-
 Belarus
-
 Belgium
-
 Bolivia
-
 Botswana
-
 Brazil
-
 Brunei
-
 Bulgaria
-
 Cambodia
-
 Cameroon
-
 Canada
-
 Chile
-
 China
-
 Colombia
-
 Congo
-
 Costa Rica
-
 Cote d'Ivoire
-
 Croatia
-
 Cuba
-
 Cyprus
-
 Czechia
-
 DR Congo
-
 Denmark
-
 Dominican Republic
-
 Ecuador
-
 Egypt
-
 El Salvador
-
 Estonia
-
 Eswatini
-
 Ethiopia
-
 Finland
-
 France
-
 Georgia
-
 Germany
-
 Ghana
-
 Greece
-
 Haiti
-
 Hong Kong
-
 Hungary
-
 India
-
 Indonesia
-
 Iran, Islamic republic
-
 Iraq
-
 Ireland
-
 Israel
-
 Italy
-
 Jamaica
-
 Japan
-
 Jordan
-
 Kazakhstan
-
 Kenya
-
 Korea
-
 Kuwait
-
 Kyrgyzstan
-
 Laos
-
 Latvia
-
 Lebanon
-
 Lesotho
-
 Libya
-
 Lithuania
-
 Luxembourg
-
 Madagascar
-
 Malaysia
-
 Malta
-
 Mauritius
-
 Mexico
-
 Moldova
-
 Mongolia
-
 Montenegro
-
 Morocco
-
 Mozambique
-
 Myanmar
-
 Namibia
-
 Nepal
-
 Netherlands
-
 New Zealand
-
 Nigeria
-
 North Macedonia
-
 Norway
-
 Oman
-
 Pakistan
-
 Palestine
-
 Panama
-
 Papua New Guinea
-
 Paraguay
-
 Peru
-
 Philippines
-
 Poland
-
 Portugal
-
 Puerto Rico
-
 Qatar
-
 Reunion
-
 Romania
-
 Rwanda
-
 Saudi Arabia
-
 Serbia
-
 Singapore
-
 Slovakia
-
 Slovenia
-
 Somalia
-
 South Africa
-
 Spain
-
 Sri Lanka
-
 Sweden
-
 Switzerland
-
 Syria
-
 Taiwan
-
 Tajikistan
-
 Tanzania
-
 Thailand
-
 Trinidad and Tobago
-
 Tunisia
-
 Turkey
-
 UAE
-
 Uganda
-
 Ukraine
-
 United Kingdom
-
United States
-
 Uruguay
-
 Uzbekistan
-
 Venezuela
-
 Vietnam
-
 Yemen
-
 Zambia
-
 Zimbabwe
- Forex
- Crypto












