

Arm stock forecast: Upside probabilities capped by $187.84 resistance

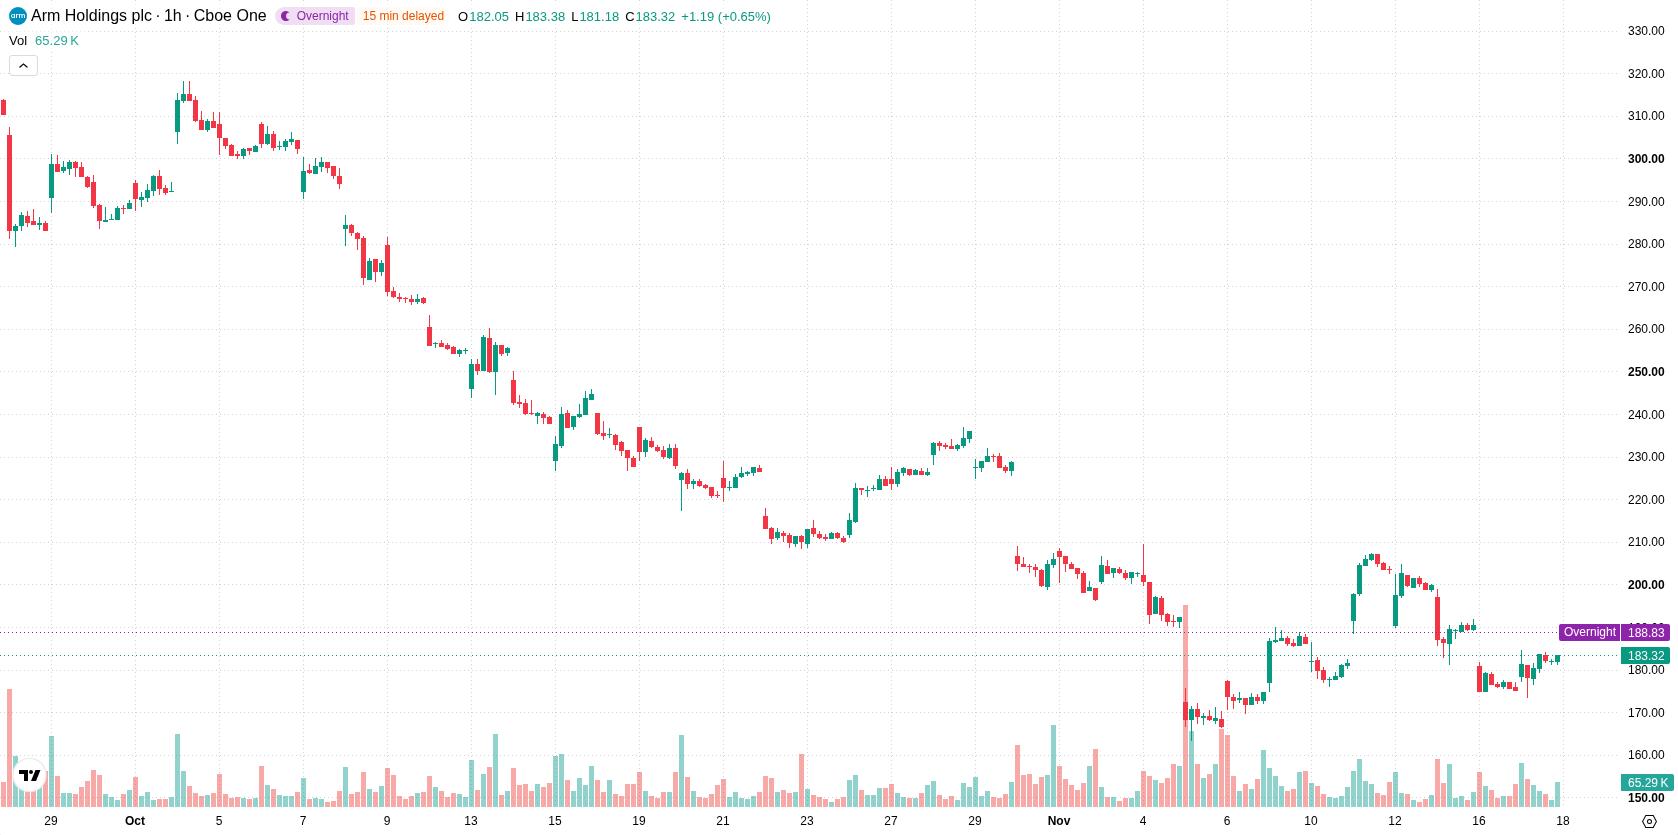
Arm Holdings (ARM) stock is trading at $183.39 after rising 4.81% intraday, holding near the day's high. The price currently sits above its recent short-term average but faces resistance from longer-term trends.
 184.56
207.31
Highlights
- ARM/USD advanced 4.81% to $183.39, maintaining strong bullish intraday action near the day’s high.
- Short-term momentum is positive, but medium and long-term moving averages indicate continued overhead resistance and seller pressure.
- The 2 to 3 day trading range is expected to be $168.25 to $198.53, with a 62% probability of a downside move.
Upside capped as mixed momentum signals weigh against resistance
On the technical front, ARM/USD is above the H1 SMA-20 at $182.11 but remains below the H1 SMA-50 at $187.95. The D1 SMA-200 is distant overhead at $233.55, underpinning a longer-term ceiling. The Ichimoku Kijun at $187.84 presents immediate resistance, with price consolidating below this threshold. While the MACD issues a strong sell signal and the ADX points to trend weakness, both RSI and CCI are neutral. Stochastic RSI is in the overbought zone, raising the risk of a near-term pullback. Bull/Bear Power stays positive at 1.48, indicating continued buyer strength intraday, though the Awesome Oscillator remains neutral.
Downside risk prevails as breakout hurdles remain in place
For the upcoming 2–3 days, the projected volatility band spans $168.25 to $198.53. Model probabilities suggest a 38% chance of further upside and a 62% likelihood of a pullback, tilting the scenario to the downside. The baseline view expects the price to continue ranging within these levels; a clear break above $187.84–$187.95 could open room for bullish extension, while a decisive fall below $182.11 may accelerate short-term selling.
Earlier, analysts noted that Arm stock faced persistent downside pressure despite strong revenue results, citing ongoing technical and fundamental challenges. Currently, with price consolidating below key long-term resistance and models favoring a pullback scenario, traders should closely monitor the $182.11–$187.95 zone for a potential directional move in the coming sessions.










-
 Afghanistan
-
 Albania
-
 Algeria
-
 Angola
-
 Argentina
-
 Armenia
-
 Australia
-
 Austria
-
 Azerbaijan
-
 Bahamas
-
 Bahrain
-
 Bangladesh
-
 Belarus
-
 Belgium
-
 Bolivia
-
 Botswana
-
 Brazil
-
 Brunei
-
 Bulgaria
-
 Cambodia
-
 Cameroon
-
 Canada
-
 Chile
-
 China
-
 Colombia
-
 Congo
-
 Costa Rica
-
 Cote d'Ivoire
-
 Croatia
-
 Cuba
-
 Cyprus
-
 Czechia
-
 DR Congo
-
 Denmark
-
 Dominican Republic
-
 Ecuador
-
 Egypt
-
 El Salvador
-
 Estonia
-
 Eswatini
-
 Ethiopia
-
 Finland
-
 France
-
 Georgia
-
 Germany
-
 Ghana
-
 Greece
-
 Haiti
-
 Hong Kong
-
 Hungary
-
 India
-
 Indonesia
-
 Iran, Islamic republic
-
 Iraq
-
 Ireland
-
 Israel
-
 Italy
-
 Jamaica
-
 Japan
-
 Jordan
-
 Kazakhstan
-
 Kenya
-
 Korea
-
 Kuwait
-
 Kyrgyzstan
-
 Laos
-
 Latvia
-
 Lebanon
-
 Lesotho
-
 Libya
-
 Lithuania
-
 Luxembourg
-
 Madagascar
-
 Malaysia
-
 Malta
-
 Mauritius
-
 Mexico
-
 Moldova
-
 Mongolia
-
 Montenegro
-
 Morocco
-
 Mozambique
-
 Myanmar
-
 Namibia
-
 Nepal
-
 Netherlands
-
 New Zealand
-
 Nigeria
-
 North Macedonia
-
 Norway
-
 Oman
-
 Pakistan
-
 Palestine
-
 Panama
-
 Papua New Guinea
-
 Paraguay
-
 Peru
-
 Philippines
-
 Poland
-
 Portugal
-
 Puerto Rico
-
 Qatar
-
 Reunion
-
 Romania
-
 Rwanda
-
 Saudi Arabia
-
 Serbia
-
 Singapore
-
 Slovakia
-
 Slovenia
-
 Somalia
-
 South Africa
-
 Spain
-
 Sri Lanka
-
 Sweden
-
 Switzerland
-
 Syria
-
 Taiwan
-
 Tajikistan
-
 Tanzania
-
 Thailand
-
 Trinidad and Tobago
-
 Tunisia
-
 Turkey
-
 UAE
-
 Uganda
-
 Ukraine
-
 United Kingdom
-
United States
-
 Uruguay
-
 Uzbekistan
-
 Venezuela
-
 Vietnam
-
 Yemen
-
 Zambia
-
 Zimbabwe
- Forex
- Crypto












