

AST SpaceMobile stock outlook: Downward momentum continues with sellers in control

AST SpaceMobile (ASTS) stock is trading at $27.59, down 3.5% on the day and nearing the session’s low amid high volatility. The price remains below its key moving averages, indicating persistent pressure from sellers across timeframes.
 29.16
36.33
Highlights
- AST SpaceMobile will issue 10 million new shares to Firefly Aerospace under an intellectual property license deal, increasing the share count.
- This equity-based licensing arrangement introduces dilution risk for existing shareholders and reveals management is funding operational needs using stock.
- Shares of AST SpaceMobile are down 3.5% to $27.59 with strong bearish signals and a forecast range of $23.18 to $32 for the next few days.
Planned share issuance to Firefly signals near-term dilution and supply risk
AST SpaceMobile filed a prospectus supplement on November 17, 2026, to issue 10 million shares of its Class A common stock to Firefly Aerospace as part of an intellectual property license agreement, according to Tipranks. This move increases the company’s outstanding share count, which can result in mechanical dilution for existing shareholders and add short-term supply pressure during market weakness. The use of equity in connection with licensing arrangements also signals management’s funding strategies amid ongoing operational needs.
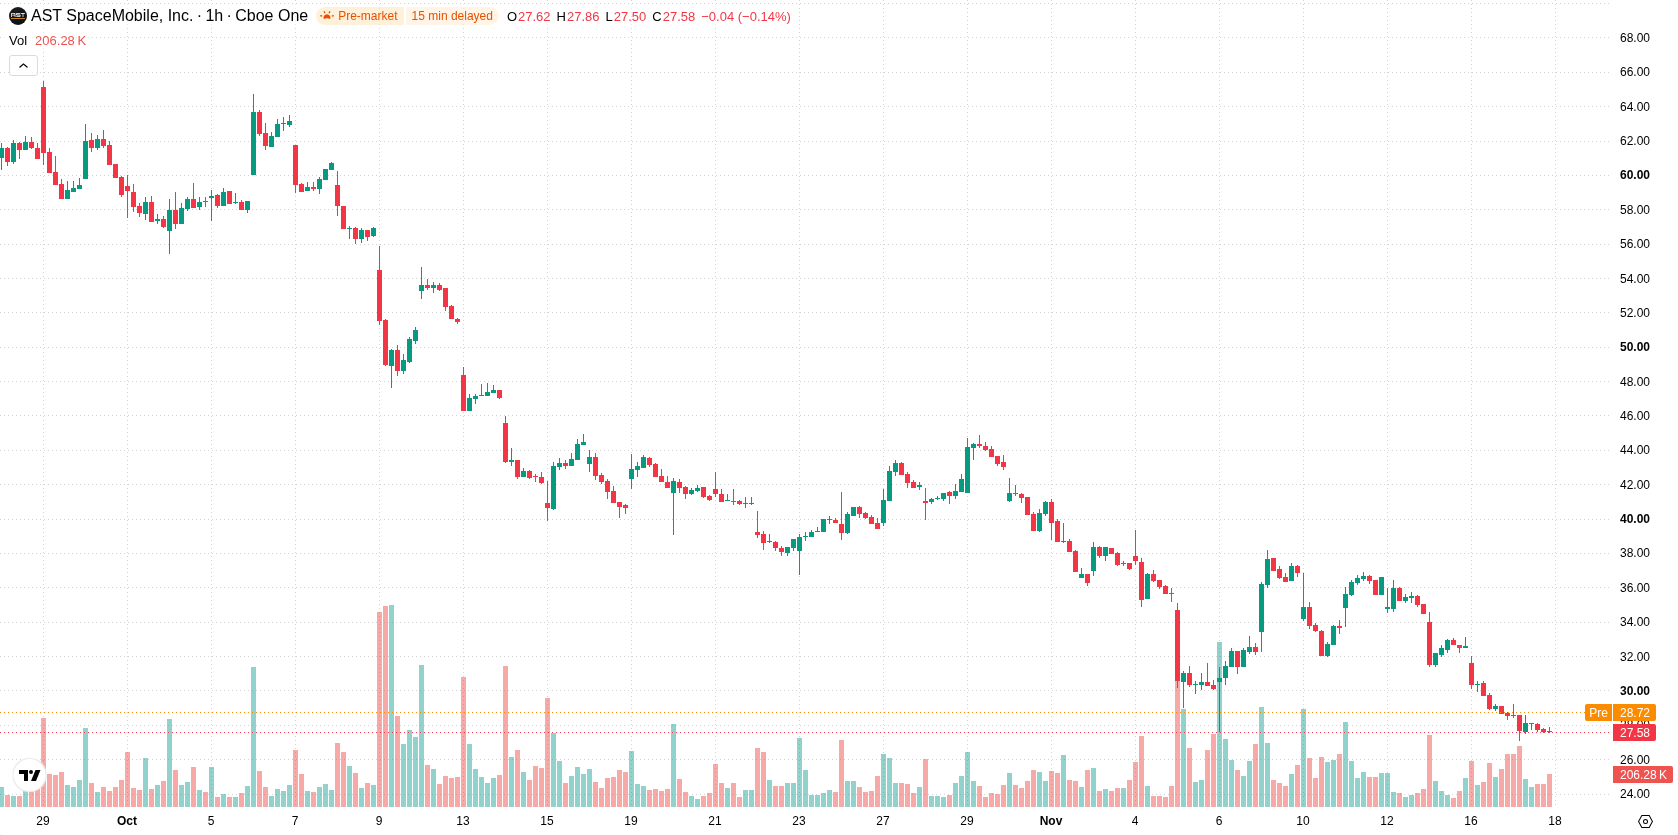
Bearish momentum intensifies as key supports fail and selling dominates
ASTS remains below the H1 SMA-20 at $29.83, the H1 SMA-50 at $33.06, and the D1 SMA-200 at $72.82. The Ichimoku Kijun level at $31.52 represents immediate resistance. Momentum indicators are negative, with both MACD and ADX on sell signals. RSI is in the oversold zone, suggesting potential selling exhaustion, while Stochastic RSI and CCI remain neutral. Bull/Bear Power is negative at -0.96, reflecting the dominance of sellers. Oscillator readings are mixed, as deeply oversold RSI contrasts with the otherwise neutral short-term signals.
Low odds of rebound as range-bound action favors downside continuation
Over the next few trading days, the likely price range for ASTS spans $23.18 to $32. Given the current technical setup, the probability of a sustained upward move is considered very low, while further downside remains highly probable. Price action is expected to consolidate within this volatility band unless key resistance at $31.52 is broken; a breakdown below $23.18 would confirm stronger bearish continuation.
Previously it was reported that AST SpaceMobile remained under notable technical and fundamental pressure, with analysts cautioning about ongoing downside risks. The current analysis reinforces this bearish outlook in light of continued selling and the potential impact of equity dilution, making a breakdown below $23.18 a critical level for further downside confirmation.






Latest AST SpaceMobile News



-
 Afghanistan
-
 Albania
-
 Algeria
-
 Angola
-
 Argentina
-
 Armenia
-
 Australia
-
 Austria
-
 Azerbaijan
-
 Bahamas
-
 Bahrain
-
 Bangladesh
-
 Belarus
-
 Belgium
-
 Bolivia
-
 Botswana
-
 Brazil
-
 Brunei
-
 Bulgaria
-
 Cambodia
-
 Cameroon
-
 Canada
-
 Chile
-
 China
-
 Colombia
-
 Congo
-
 Costa Rica
-
 Cote d'Ivoire
-
 Croatia
-
 Cuba
-
 Cyprus
-
 Czechia
-
 DR Congo
-
 Denmark
-
 Dominican Republic
-
 Ecuador
-
 Egypt
-
 El Salvador
-
 Estonia
-
 Eswatini
-
 Ethiopia
-
 Finland
-
 France
-
 Georgia
-
 Germany
-
 Ghana
-
 Greece
-
 Haiti
-
 Hong Kong
-
 Hungary
-
 India
-
 Indonesia
-
 Iran, Islamic republic
-
 Iraq
-
 Ireland
-
 Israel
-
 Italy
-
 Jamaica
-
 Japan
-
 Jordan
-
 Kazakhstan
-
 Kenya
-
 Korea
-
 Kuwait
-
 Kyrgyzstan
-
 Laos
-
 Latvia
-
 Lebanon
-
 Lesotho
-
 Libya
-
 Lithuania
-
 Luxembourg
-
 Madagascar
-
 Malaysia
-
 Malta
-
 Mauritius
-
 Mexico
-
 Moldova
-
 Mongolia
-
 Montenegro
-
 Morocco
-
 Mozambique
-
 Myanmar
-
 Namibia
-
 Nepal
-
 Netherlands
-
 New Zealand
-
 Nigeria
-
 North Macedonia
-
 Norway
-
 Oman
-
 Pakistan
-
 Palestine
-
 Panama
-
 Papua New Guinea
-
 Paraguay
-
 Peru
-
 Philippines
-
 Poland
-
 Portugal
-
 Puerto Rico
-
 Qatar
-
 Reunion
-
 Romania
-
 Rwanda
-
 Saudi Arabia
-
 Serbia
-
 Singapore
-
 Slovakia
-
 Slovenia
-
 Somalia
-
 South Africa
-
 Spain
-
 Sri Lanka
-
 Sweden
-
 Switzerland
-
 Syria
-
 Taiwan
-
 Tajikistan
-
 Tanzania
-
 Thailand
-
 Trinidad and Tobago
-
 Tunisia
-
 Turkey
-
 UAE
-
 Uganda
-
 Ukraine
-
 United Kingdom
-
United States
-
 Uruguay
-
 Uzbekistan
-
 Venezuela
-
 Vietnam
-
 Yemen
-
 Zambia
-
 Zimbabwe
- Forex
- Crypto












