

Royal Bank of Canada shares technical analysis: Weak momentum signals prevail below resistance

Royal Bank of Canada (RY) stock is trading at C$280.99, down 1.61% for the day. The price sits below its key short- and medium-term moving averages but remains above its longer-term trend level.
 280.08
290.40
Highlights
- Short interest in Royal Bank of Canada stock fell 39.6% in the second half of October, indicating a substantial unwind of bearish positions.
- Despite the drop in short positions, Royal Bank of Canada stock continues to experience negative price momentum.
- Technical analysis shows strong short- and medium-term selling pressure, with price likely to trade between C$275.71 and C$286.27 and a very high probability of a further decline.
Short covering offsets but fails to reverse persistent sell momentum
Royal Bank of Canada experienced a pronounced reduction in short interest during October, with the number of shares sold short decreasing by 39.6% from October 15 to October 30, according to MarketBeat. This shift reflects a notable unwind of previously held bearish positions, which can lead to lower covering activity in the short term. However, changes in short positioning alone have not prevented the current negative price momentum.
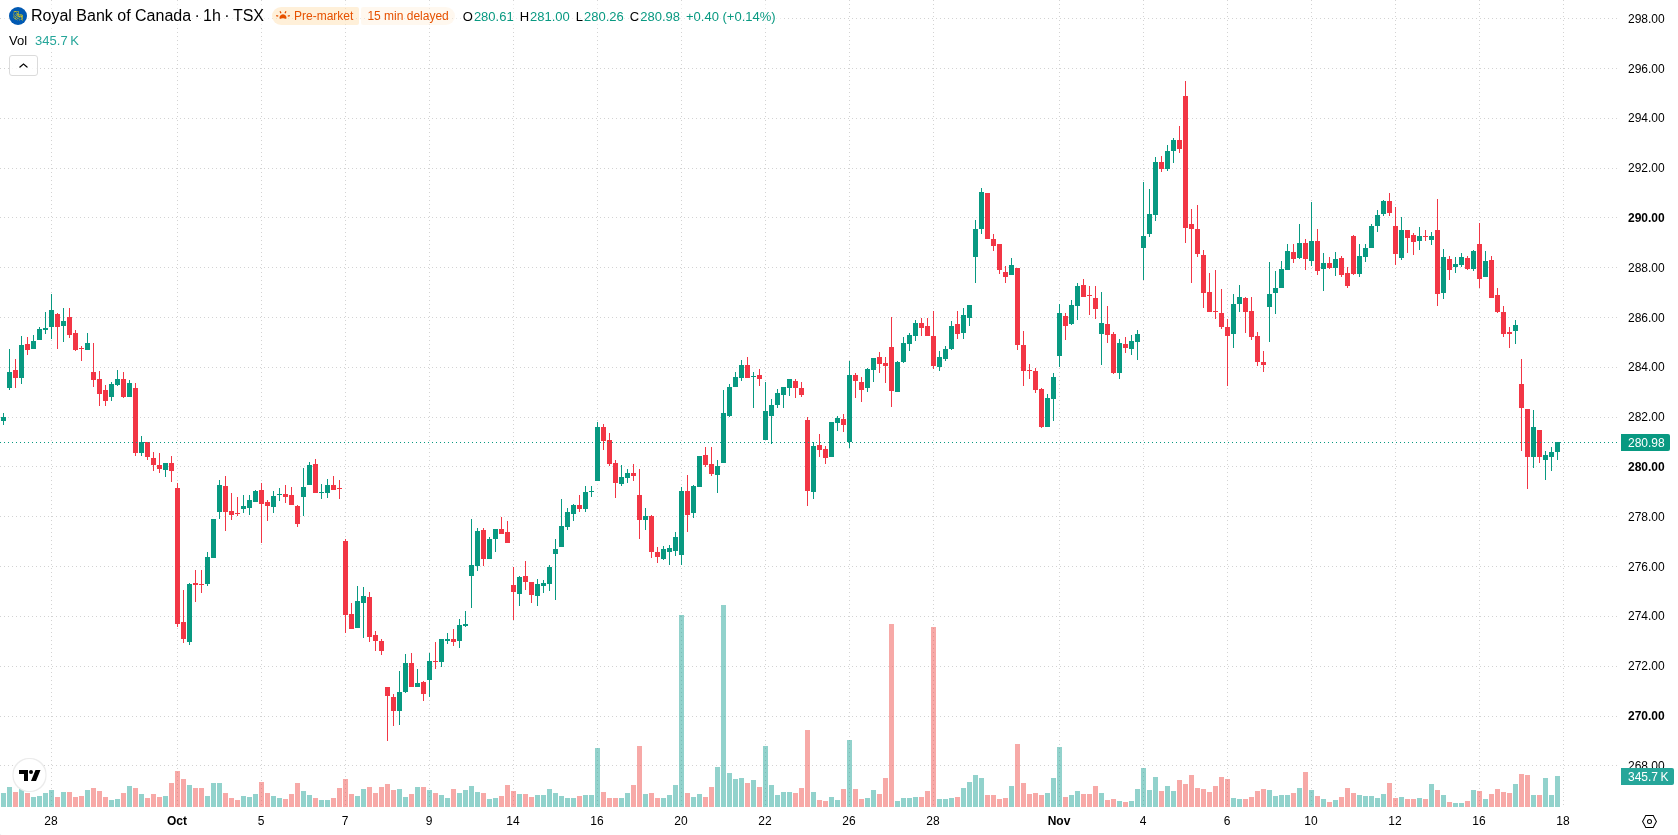
Seller control persists as indicators show weak momentum below resistance
On the technical front, RY is trading below the H1 SMA-20 at C$285.06 and H1 SMA-50 at C$287.1, while maintaining levels above the D1 SMA-200 at C$266.13. Immediate overhead resistance is marked at the Ichimoku Kijun level of C$284.91. Momentum indicators are weak, with both MACD and ADX registering Sell signals. Oscillators including RSI, Stoch RSI, and CCI remain in neutral zones, indicating a lack of extremes. Bull/Bear Power has a negative reading at -1.95, underscoring seller dominance in the current tape, while the Awesome Oscillator is not providing any clear trend direction.
Range-bound bias prevails as downside breakout risk dominates
Over the next 2 to 3 trading days, RY is expected to remain volatile within a projected range of C$275.71 to C$286.27. The probability of an upside breakout is low, under 20%, while chances for further downward movement exceed 80%. The most likely scenario is sideways to lower movement within this volatility band, unless buyers are able to overcome immediate resistance. A decisive move below C$275.71 would likely accelerate downside momentum, whereas a break above resistance could trigger a technical rebound.
Earlier, analysts noted that Royal Bank of Canada was experiencing persistent near-term selling pressure despite underlying long-term technical support and increased institutional activity. The current analysis builds on this by highlighting sustained technical weakness and a substantial decline in short interest, suggesting that the key level to watch is a potential breakdown below C$275.71, which could trigger further downside momentum in the near term.










-
 Afghanistan
-
 Albania
-
 Algeria
-
 Angola
-
 Argentina
-
 Armenia
-
 Australia
-
 Austria
-
 Azerbaijan
-
 Bahamas
-
 Bahrain
-
 Bangladesh
-
 Belarus
-
 Belgium
-
 Bolivia
-
 Botswana
-
 Brazil
-
 Brunei
-
 Bulgaria
-
 Cambodia
-
 Cameroon
-
 Canada
-
 Chile
-
 China
-
 Colombia
-
 Congo
-
 Costa Rica
-
 Cote d'Ivoire
-
 Croatia
-
 Cuba
-
 Cyprus
-
 Czechia
-
 DR Congo
-
 Denmark
-
 Dominican Republic
-
 Ecuador
-
 Egypt
-
 El Salvador
-
 Estonia
-
 Eswatini
-
 Ethiopia
-
 Finland
-
 France
-
 Georgia
-
 Germany
-
 Ghana
-
 Greece
-
 Haiti
-
 Hong Kong
-
 Hungary
-
 India
-
 Indonesia
-
 Iran, Islamic republic
-
 Iraq
-
 Ireland
-
 Israel
-
 Italy
-
 Jamaica
-
 Japan
-
 Jordan
-
 Kazakhstan
-
 Kenya
-
 Korea
-
 Kuwait
-
 Kyrgyzstan
-
 Laos
-
 Latvia
-
 Lebanon
-
 Lesotho
-
 Libya
-
 Lithuania
-
 Luxembourg
-
 Madagascar
-
 Malaysia
-
 Malta
-
 Mauritius
-
 Mexico
-
 Moldova
-
 Mongolia
-
 Montenegro
-
 Morocco
-
 Mozambique
-
 Myanmar
-
 Namibia
-
 Nepal
-
 Netherlands
-
 New Zealand
-
 Nigeria
-
 North Macedonia
-
 Norway
-
 Oman
-
 Pakistan
-
 Palestine
-
 Panama
-
 Papua New Guinea
-
 Paraguay
-
 Peru
-
 Philippines
-
 Poland
-
 Portugal
-
 Puerto Rico
-
 Qatar
-
 Reunion
-
 Romania
-
 Rwanda
-
 Saudi Arabia
-
 Serbia
-
 Singapore
-
 Slovakia
-
 Slovenia
-
 Somalia
-
 South Africa
-
 Spain
-
 Sri Lanka
-
 Sweden
-
 Switzerland
-
 Syria
-
 Taiwan
-
 Tajikistan
-
 Tanzania
-
 Thailand
-
 Trinidad and Tobago
-
 Tunisia
-
 Turkey
-
 UAE
-
 Uganda
-
 Ukraine
-
 United Kingdom
-
United States
-
 Uruguay
-
 Uzbekistan
-
 Venezuela
-
 Vietnam
-
 Yemen
-
 Zambia
-
 Zimbabwe
- Forex
- Crypto












