

Barrick Gold stock outlook: Downward price move persists as seller pressure dominates

Barrick Gold (ABX) stock is trading at C$49.73 after a 5.02% decline on the day. The price sits below its primary short-, medium-, and long-term moving averages, signaling ongoing downward momentum.
 50.99
55.11
Highlights
- The Public Sector Pension Investment Board increased its stake in Barrick Gold by 34.7% in the third quarter, adding 826,868 shares.
- First Eagle Investment Management cut its Barrick Gold holding by 49.4%, while Duquesne Family Office opened a $42.9 million position with 1,054,600 shares.
- Barrick Gold stock trades below key moving averages with strong bearish momentum and is expected to range from C$48.31 to C$52.14 in the near term.
Institutional share shifts as major investors rebalance holdings
The most significant recent event involved the Public Sector Pension Investment Board acquiring an additional 826,868 shares of Barrick Gold in the third quarter, increasing its position by 34.7%, according to MarketBeat. This move by a major Canadian institution can reinforce the stock's liquidity and long-term demand profile. Meanwhile, First Eagle Investment Management LLC reduced its holding in Barrick Gold by 49.4% in the same period, also per MarketBeat, while Stanley Druckenmiller’s Duquesne Family Office initiated a sizeable new position, acquiring approximately 1,054,600 shares valued at $42.9 million, according to Benzinga. Taken together, these shifts among institutional shareholders reflect mixed sentiment and portfolio rebalancing around the stock during the most recent quarter.
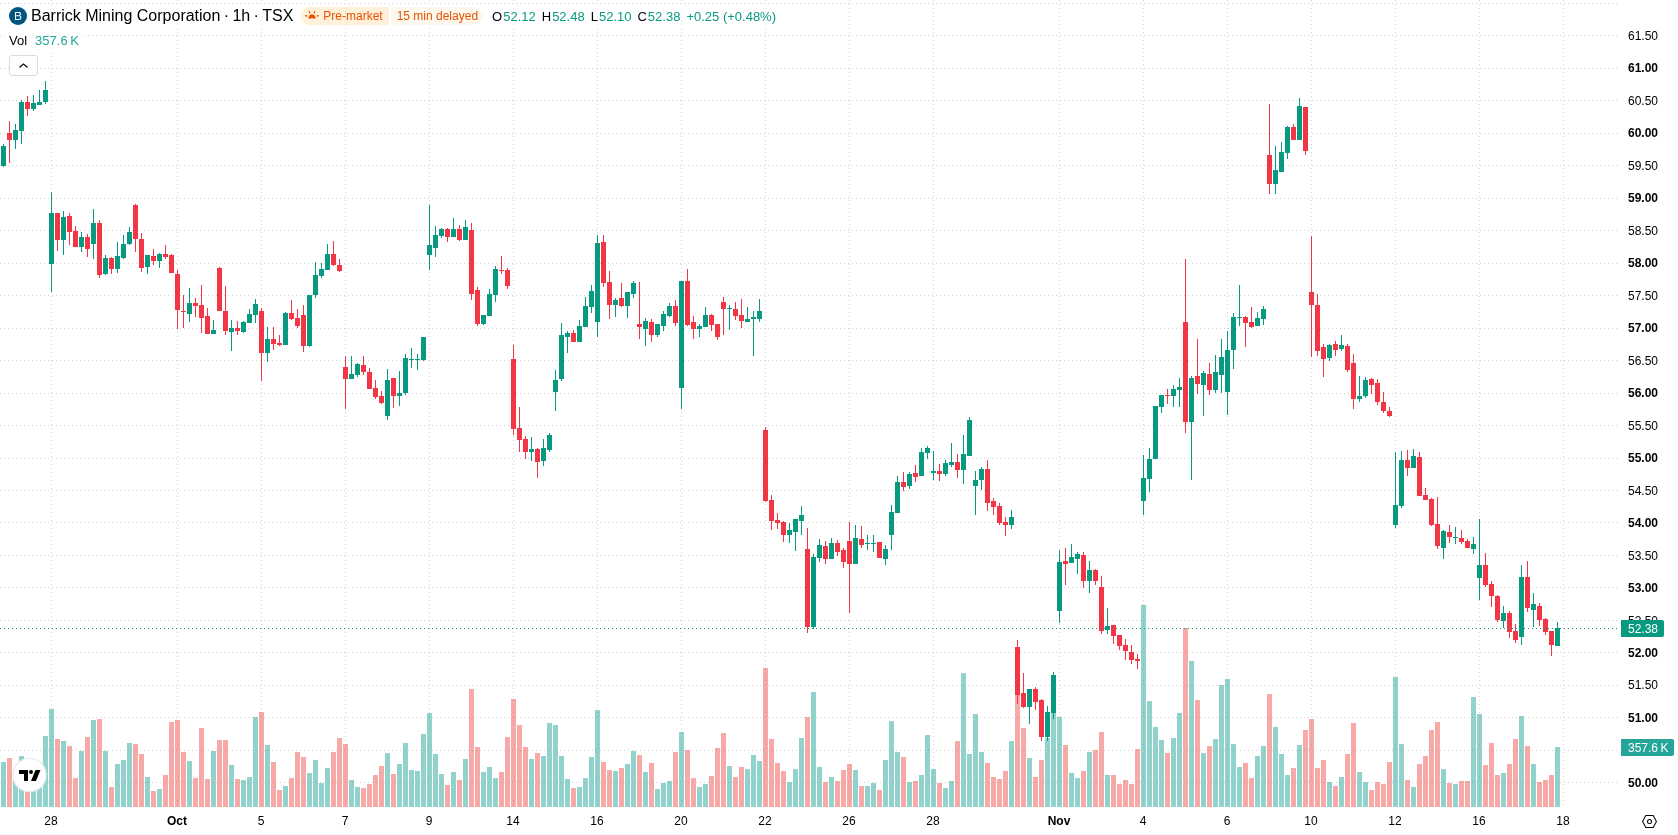
Persistent bearish momentum as resistance zones cap intraday rallies
Technically, the price remains under the H1 SMA-20 at C$52.97, H1 SMA-50 at C$55.18, and D1 SMA-200 at C$57.73. The Ichimoku Kijun stands at C$53.54 and acts as the nearest resistance. MACD shows strong sell momentum, and the ADX indicates an established bearish trend. Oscillator readings are neutral, with the RSI, Stochastic RSI, and CCI all showing no extremes. Bull/Bear Power is slightly negative at -0.24, pointing to intraday seller dominance, while the Awesome Oscillator is also neutral and does not add directional confirmation.
High downside risk as volatility band narrows potential
For the coming sessions, ABX is expected to trade within a volatility band between C$48.31 and C$52.14. The probability of further downside movement is very high, with limited prospects for an upward move. The baseline scenario calls for price consolidation within this corridor. A break above C$53.54 would signal recovery potential, while a move below C$48.31 could open the way for additional declines.
Earlier, analysts noted that Barrick Gold faced persistent technical pressure with downside risks prevailing despite improvements in operating results. The current technical structure and recent shifts in institutional positioning reinforce a bearish outlook, with C$48.31 now emerging as a key level to watch for potential further declines.










-
 Afghanistan
-
 Albania
-
 Algeria
-
 Angola
-
 Argentina
-
 Armenia
-
 Australia
-
 Austria
-
 Azerbaijan
-
 Bahamas
-
 Bahrain
-
 Bangladesh
-
 Belarus
-
 Belgium
-
 Bolivia
-
 Botswana
-
 Brazil
-
 Brunei
-
 Bulgaria
-
 Cambodia
-
 Cameroon
-
 Canada
-
 Chile
-
 China
-
 Colombia
-
 Congo
-
 Costa Rica
-
 Cote d'Ivoire
-
 Croatia
-
 Cuba
-
 Cyprus
-
 Czechia
-
 DR Congo
-
 Denmark
-
 Dominican Republic
-
 Ecuador
-
 Egypt
-
 El Salvador
-
 Estonia
-
 Eswatini
-
 Ethiopia
-
 Finland
-
 France
-
 Georgia
-
 Germany
-
 Ghana
-
 Greece
-
 Haiti
-
 Hong Kong
-
 Hungary
-
 India
-
 Indonesia
-
 Iran, Islamic republic
-
 Iraq
-
 Ireland
-
 Israel
-
 Italy
-
 Jamaica
-
 Japan
-
 Jordan
-
 Kazakhstan
-
 Kenya
-
 Korea
-
 Kuwait
-
 Kyrgyzstan
-
 Laos
-
 Latvia
-
 Lebanon
-
 Lesotho
-
 Libya
-
 Lithuania
-
 Luxembourg
-
 Madagascar
-
 Malaysia
-
 Malta
-
 Mauritius
-
 Mexico
-
 Moldova
-
 Mongolia
-
 Montenegro
-
 Morocco
-
 Mozambique
-
 Myanmar
-
 Namibia
-
 Nepal
-
 Netherlands
-
 New Zealand
-
 Nigeria
-
 North Macedonia
-
 Norway
-
 Oman
-
 Pakistan
-
 Palestine
-
 Panama
-
 Papua New Guinea
-
 Paraguay
-
 Peru
-
 Philippines
-
 Poland
-
 Portugal
-
 Puerto Rico
-
 Qatar
-
 Reunion
-
 Romania
-
 Rwanda
-
 Saudi Arabia
-
 Serbia
-
 Singapore
-
 Slovakia
-
 Slovenia
-
 Somalia
-
 South Africa
-
 Spain
-
 Sri Lanka
-
 Sweden
-
 Switzerland
-
 Syria
-
 Taiwan
-
 Tajikistan
-
 Tanzania
-
 Thailand
-
 Trinidad and Tobago
-
 Tunisia
-
 Turkey
-
 UAE
-
 Uganda
-
 Ukraine
-
 United Kingdom
-
United States
-
 Uruguay
-
 Uzbekistan
-
 Venezuela
-
 Vietnam
-
 Yemen
-
 Zambia
-
 Zimbabwe
- Forex
- Crypto












