

UiPath shares technical analysis: Bearish setup holds as price nears $11.49 support

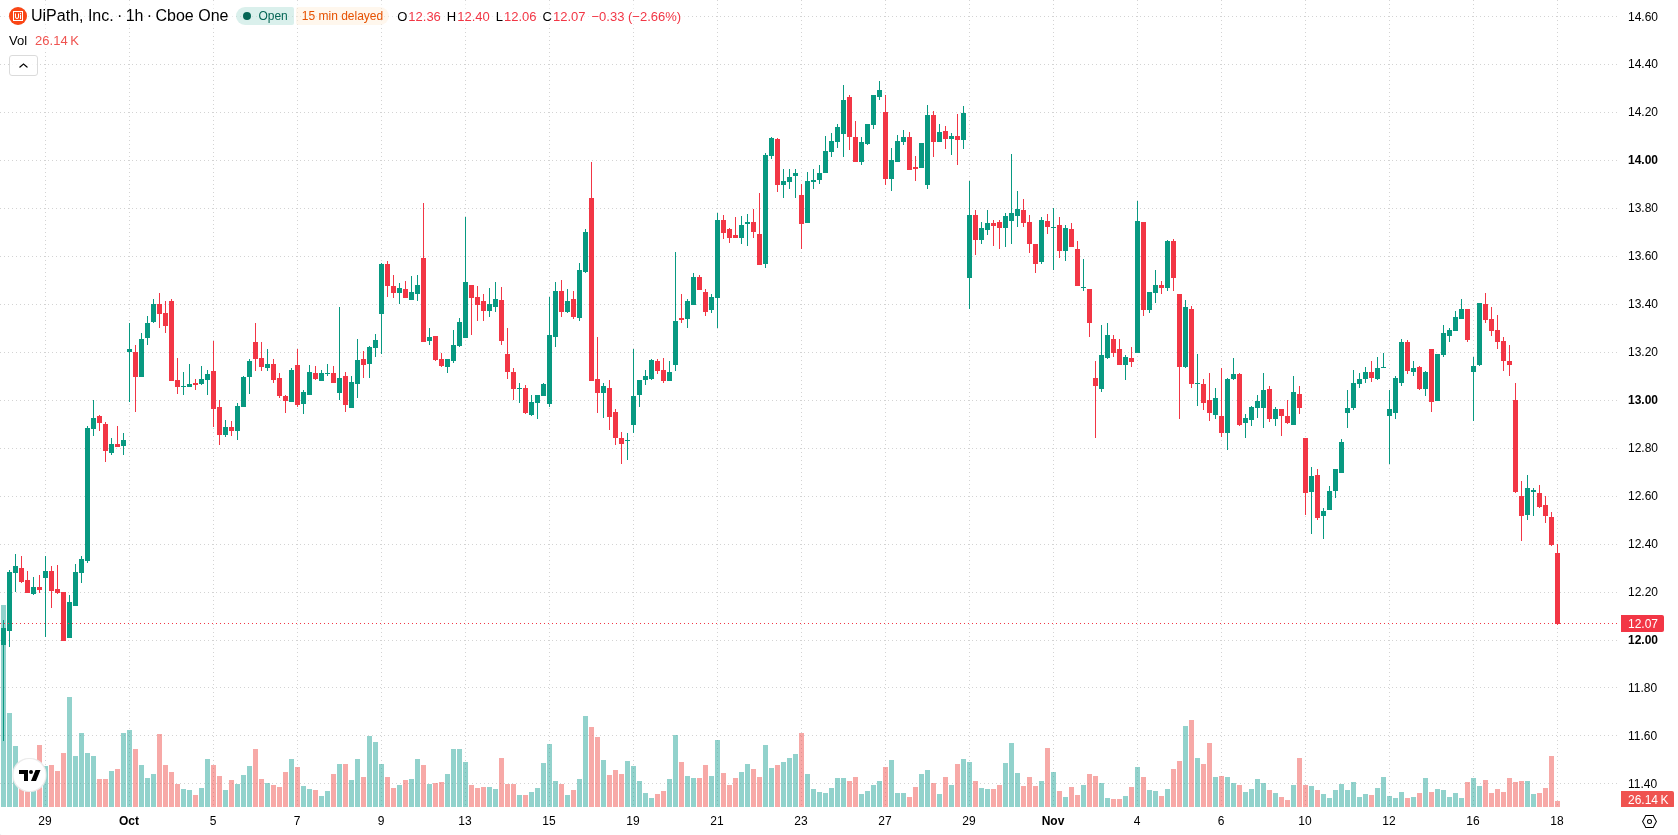
UiPath (PATH) stock is trading at $11.96 after falling 3.55% today. The price remains below its key moving averages, reflecting ongoing weakness in the short, medium, and long-term trends.
 13.03
13.44
Highlights
- Shares of UiPath fell 5.7% on November 17, 2026, breaking below their 52-week range of $9.20 to $19.84.
- The breach of this key support zone led to technical selling and increased downward pressure on the stock.
- Technical signals indicate sustained downside momentum, with likely consolidation between $11.49 to $12.5 in coming sessions and low probability of a near-term rebound.
Downward pressure accelerates as key support zone is breached
On November 17, 2026, UiPath shares experienced a 5.7% decline and breached their recent 52-week trading range of $9.20 to $19.84, according to Gurufocus. The breakdown below this established range likely triggered technical selling and contributed to increased downward pressure, as investors responded to the loss of a key support zone. This breach has further weakened short-term sentiment around the stock.
Bearish momentum maintained as oversold signals suggest exhaustion
Technical analysis shows PATH is trading below H1 SMA-20 at $13.02, H1 SMA-50 at $12.98, and D1 SMA-200 at $12.32. The Ichimoku Kijun level at $12.92 marks immediate resistance for any attempted rebound. Momentum indicators reveal that both MACD and ADX maintain a bearish setup. RSI is neutral, while Stochastic RSI and CCI are in oversold zones, signaling short-term selling exhaustion but not a guaranteed reversal. Bull/Bear Power stands at -0.25, confirming intraday seller dominance.
Consolidation expected as downside risk outweighs recovery odds
Over the next several sessions, the anticipated price range for PATH is $11.49 to $12.5, with a high probability of continued downside and a low probability of an upward move. The baseline scenario suggests consolidation within this range given the prevailing pressure. If the price breaks above $12.92 resistance, a bullish reversal could begin; a drop below $11.49 support would signal the likelihood of an extended decline.
Earlier, analysts noted that UiPath shares were under sustained selling pressure, with price action favoring further consolidation amid downside risks. The current breakdown below the 52-week trading range and persistent bearish technical signals reinforce this caution, making a close watch of the $11.49 support level critical for assessing the potential for renewed declines.










-
 Afghanistan
-
 Albania
-
 Algeria
-
 Angola
-
 Argentina
-
 Armenia
-
 Australia
-
 Austria
-
 Azerbaijan
-
 Bahamas
-
 Bahrain
-
 Bangladesh
-
 Belarus
-
 Belgium
-
 Bolivia
-
 Botswana
-
 Brazil
-
 Brunei
-
 Bulgaria
-
 Cambodia
-
 Cameroon
-
 Canada
-
 Chile
-
 China
-
 Colombia
-
 Congo
-
 Costa Rica
-
 Cote d'Ivoire
-
 Croatia
-
 Cuba
-
 Cyprus
-
 Czechia
-
 DR Congo
-
 Denmark
-
 Dominican Republic
-
 Ecuador
-
 Egypt
-
 El Salvador
-
 Estonia
-
 Eswatini
-
 Ethiopia
-
 Finland
-
 France
-
 Georgia
-
 Germany
-
 Ghana
-
 Greece
-
 Haiti
-
 Hong Kong
-
 Hungary
-
 India
-
 Indonesia
-
 Iran, Islamic republic
-
 Iraq
-
 Ireland
-
 Israel
-
 Italy
-
 Jamaica
-
 Japan
-
 Jordan
-
 Kazakhstan
-
 Kenya
-
 Korea
-
 Kuwait
-
 Kyrgyzstan
-
 Laos
-
 Latvia
-
 Lebanon
-
 Lesotho
-
 Libya
-
 Lithuania
-
 Luxembourg
-
 Madagascar
-
 Malaysia
-
 Malta
-
 Mauritius
-
 Mexico
-
 Moldova
-
 Mongolia
-
 Montenegro
-
 Morocco
-
 Mozambique
-
 Myanmar
-
 Namibia
-
 Nepal
-
 Netherlands
-
 New Zealand
-
 Nigeria
-
 North Macedonia
-
 Norway
-
 Oman
-
 Pakistan
-
 Palestine
-
 Panama
-
 Papua New Guinea
-
 Paraguay
-
 Peru
-
 Philippines
-
 Poland
-
 Portugal
-
 Puerto Rico
-
 Qatar
-
 Reunion
-
 Romania
-
 Rwanda
-
 Saudi Arabia
-
 Serbia
-
 Singapore
-
 Slovakia
-
 Slovenia
-
 Somalia
-
 South Africa
-
 Spain
-
 Sri Lanka
-
 Sweden
-
 Switzerland
-
 Syria
-
 Taiwan
-
 Tajikistan
-
 Tanzania
-
 Thailand
-
 Trinidad and Tobago
-
 Tunisia
-
 Turkey
-
 UAE
-
 Uganda
-
 Ukraine
-
 United Kingdom
-
United States
-
 Uruguay
-
 Uzbekistan
-
 Venezuela
-
 Vietnam
-
 Yemen
-
 Zambia
-
 Zimbabwe
- Forex
- Crypto












