

Bit Digital stock falls amid renewed downward price move

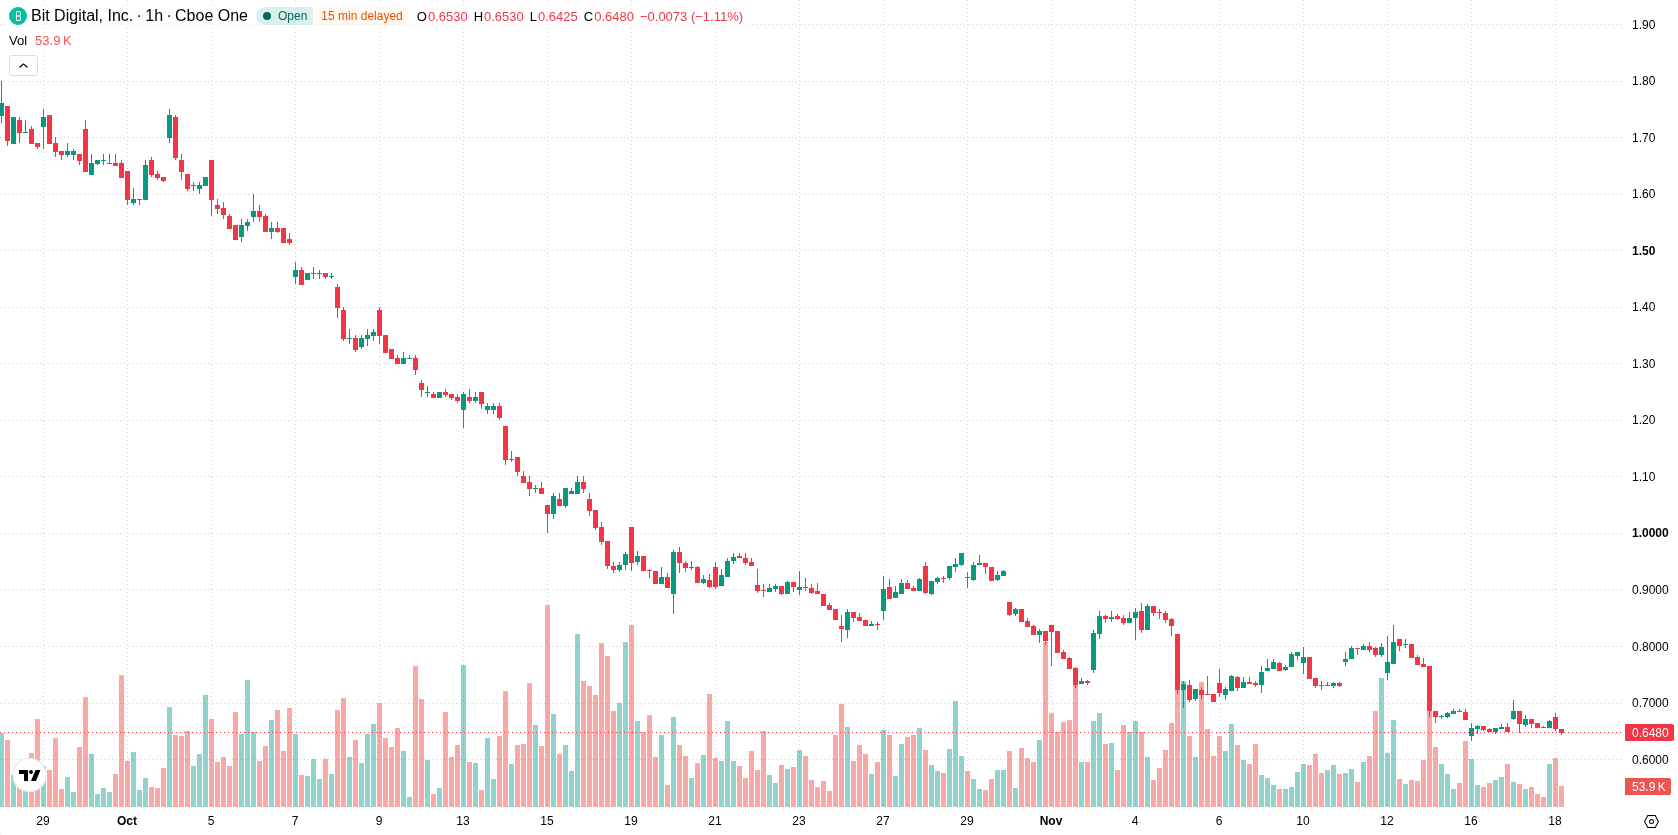
Bit Digital Inc. (BTBT) stock is trading at $0.64, down 2.84% on the session. The price has moved lower today, positioning it below its key moving averages, which reflects continued pressure in the short term.
 0.7008
0.8386
Highlights
- BTBT/USD trades below major moving averages, with price at $0.64 and persistent bearish pressure across short to long timeframes.
- Momentum indicators are negative or neutral, and Stoch RSI is overbought, signaling a potential for further downside correction.
- The price range for the next 2 to 3 days is projected at $0.56 to $0.74, with upside probability very low and high likelihood of a move down.
Technical weakness persists as major momentum signals stay bearish
On the technical front, BTBT is trading below the H1 SMA-20 at $0.67, the H1 SMA-50 at $0.73, and the D1 SMA-200 at $1.54. The Ichimoku Kijun at $0.72 is acting as immediate resistance. Momentum indicators show MACD at a Strong Sell and ADX at Sell, while RSI and CCI are both in neutral zones. Stoch RSI is currently in the overbought zone, flagging potential downside correction risk, though reversal confirmation is absent. Bull/Bear Power reads 0, reflecting a lack of clear dominance by buyers or sellers, while the Awesome Oscillator is also neutral.
Downside risk dominates as limited upside caps near-term outlook
Looking ahead over the next 2 to 3 trading days, the typical volatility band is projected between $0.56 and $0.74. The probability of further upside is very low, with a strong likelihood of a move lower. The most likely scenario is sideways consolidation within this range, but a clear bullish reversal would require a sustained breakout above immediate resistance. If support fails, a move toward the lower end of the forecasted range is expected.
Earlier, analysts noted that Bit Digital continued to face sustained bearish technical pressure, with downside risks prevailing over any sign of reversal. The current analysis reinforces this negative bias and highlights that, going forward, traders should watch for a decisive move below support or a breakout above immediate resistance to signal the next directional move.









-
 Afghanistan
-
 Albania
-
 Algeria
-
 Angola
-
 Argentina
-
 Armenia
-
 Australia
-
 Austria
-
 Azerbaijan
-
 Bahamas
-
 Bahrain
-
 Bangladesh
-
 Belarus
-
 Belgium
-
 Bolivia
-
 Botswana
-
 Brazil
-
 Brunei
-
 Bulgaria
-
 Cambodia
-
 Cameroon
-
 Canada
-
 Chile
-
 China
-
 Colombia
-
 Congo
-
 Costa Rica
-
 Cote d'Ivoire
-
 Croatia
-
 Cuba
-
 Cyprus
-
 Czechia
-
 DR Congo
-
 Denmark
-
 Dominican Republic
-
 Ecuador
-
 Egypt
-
 El Salvador
-
 Estonia
-
 Eswatini
-
 Ethiopia
-
 Finland
-
 France
-
 Georgia
-
 Germany
-
 Ghana
-
 Greece
-
 Haiti
-
 Hong Kong
-
 Hungary
-
 India
-
 Indonesia
-
 Iran, Islamic republic
-
 Iraq
-
 Ireland
-
 Israel
-
 Italy
-
 Jamaica
-
 Japan
-
 Jordan
-
 Kazakhstan
-
 Kenya
-
 Korea
-
 Kuwait
-
 Kyrgyzstan
-
 Laos
-
 Latvia
-
 Lebanon
-
 Lesotho
-
 Libya
-
 Lithuania
-
 Luxembourg
-
 Madagascar
-
 Malaysia
-
 Malta
-
 Mauritius
-
 Mexico
-
 Moldova
-
 Mongolia
-
 Montenegro
-
 Morocco
-
 Mozambique
-
 Myanmar
-
 Namibia
-
 Nepal
-
 Netherlands
-
 New Zealand
-
 Nigeria
-
 North Macedonia
-
 Norway
-
 Oman
-
 Pakistan
-
 Palestine
-
 Panama
-
 Papua New Guinea
-
 Paraguay
-
 Peru
-
 Philippines
-
 Poland
-
 Portugal
-
 Puerto Rico
-
 Qatar
-
 Reunion
-
 Romania
-
 Rwanda
-
 Saudi Arabia
-
 Serbia
-
 Singapore
-
 Slovakia
-
 Slovenia
-
 Somalia
-
 South Africa
-
 Spain
-
 Sri Lanka
-
 Sweden
-
 Switzerland
-
 Syria
-
 Taiwan
-
 Tajikistan
-
 Tanzania
-
 Thailand
-
 Trinidad and Tobago
-
 Tunisia
-
 Turkey
-
 UAE
-
 Uganda
-
 Ukraine
-
 United Kingdom
-
United States
-
 Uruguay
-
 Uzbekistan
-
 Venezuela
-
 Vietnam
-
 Yemen
-
 Zambia
-
 Zimbabwe
- Forex
- Crypto












