

Will Agnico Eagle Mines stock hold above C$219.83 support as sellers dominate?

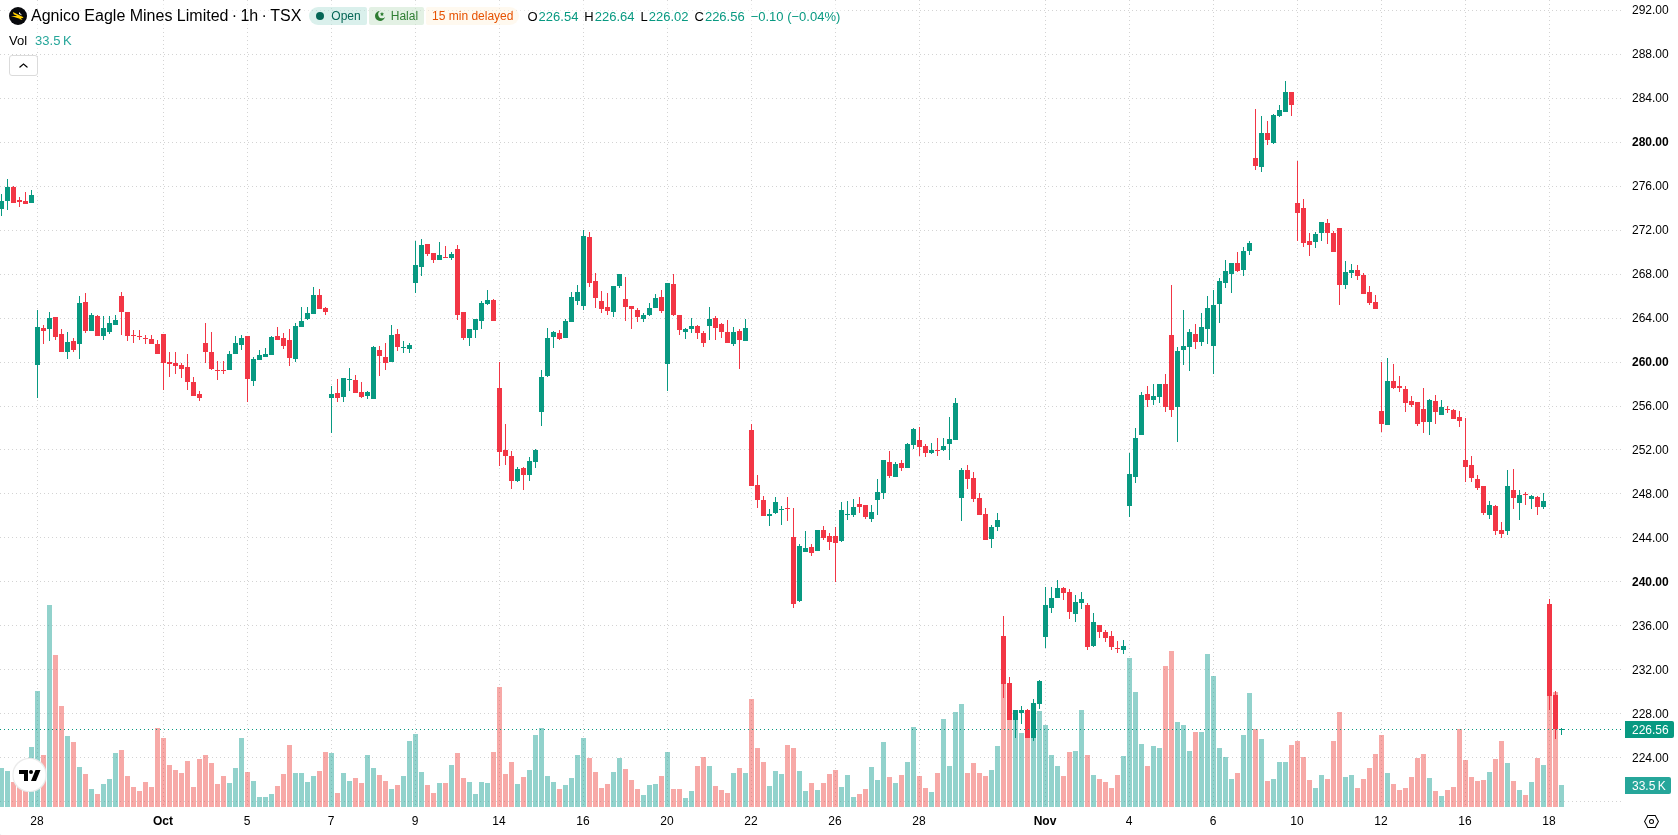
Agnico Eagle Mines (AEM) stock is trading at C$227.14 after a sharp daily loss of 8.3%. The move leaves it well below its key moving averages, signaling strong downward momentum in the short, medium, and long term.
 237.93
260.33
Highlights
- Shares of Agnico Eagle Mines fell sharply by 8.3% to C$227.14 with the price near the daily low and exhibiting high volatility.
- Agnico Eagle Mines stock trades below major short-, medium-, and long-term moving averages, indicating persistent selling pressure across all timeframes.
- Technical indicators skew bearish, with strong sell signals from MACD and ADX and an expected price range of C$219.83 to C$234.45 over the next several days.
Sustained price weakness as multiple indicators confirm seller control
On the technical front, AEM is trading below the H1 SMA-20 at C$249.89, the H1 SMA-50 at C$261.19, and the D1 SMA-200 at C$261.07. The Ichimoku Kijun level at C$251.84 stands as immediate resistance. Momentum indicators point to pronounced weakness, with MACD at Strong Sell, ADX at Sell, and negative Bull/Bear Power at -0.68—confirming intraday seller control. Oscillators present mixed signals: RSI and CCI are neutral, while Stoch RSI is overbought, suggesting increased downside correction risk. The Awesome Oscillator gives no clear directional bias.
Further downside risk elevated amid narrow volatility corridor
For the next several days, AEM is likely to trade within the C$219.83 to C$234.45 range, matching the current volatility band. The probability of an upward move is very low, while further downside is highly probable. The baseline scenario is for sideways action within this corridor. A bullish scenario would be triggered if price breaks above immediate resistance at the Ichimoku Kijun level; conversely, a drop below support could open the way to additional losses.
Earlier, analysts noted that Agnico Eagle Mines was facing persistent technical headwinds and sustained downside risks. The latest breakdown below key moving averages and confirmation from multiple momentum indicators reinforce the bearish view, with the C$219.83 level now serving as a critical threshold for further weakness in the days ahead.










-
 Afghanistan
-
 Albania
-
 Algeria
-
 Angola
-
 Argentina
-
 Armenia
-
 Australia
-
 Austria
-
 Azerbaijan
-
 Bahamas
-
 Bahrain
-
 Bangladesh
-
 Belarus
-
 Belgium
-
 Bolivia
-
 Botswana
-
 Brazil
-
 Brunei
-
 Bulgaria
-
 Cambodia
-
 Cameroon
-
 Canada
-
 Chile
-
 China
-
 Colombia
-
 Congo
-
 Costa Rica
-
 Cote d'Ivoire
-
 Croatia
-
 Cuba
-
 Cyprus
-
 Czechia
-
 DR Congo
-
 Denmark
-
 Dominican Republic
-
 Ecuador
-
 Egypt
-
 El Salvador
-
 Estonia
-
 Eswatini
-
 Ethiopia
-
 Finland
-
 France
-
 Georgia
-
 Germany
-
 Ghana
-
 Greece
-
 Haiti
-
 Hong Kong
-
 Hungary
-
 India
-
 Indonesia
-
 Iran, Islamic republic
-
 Iraq
-
 Ireland
-
 Israel
-
 Italy
-
 Jamaica
-
 Japan
-
 Jordan
-
 Kazakhstan
-
 Kenya
-
 Korea
-
 Kuwait
-
 Kyrgyzstan
-
 Laos
-
 Latvia
-
 Lebanon
-
 Lesotho
-
 Libya
-
 Lithuania
-
 Luxembourg
-
 Madagascar
-
 Malaysia
-
 Malta
-
 Mauritius
-
 Mexico
-
 Moldova
-
 Mongolia
-
 Montenegro
-
 Morocco
-
 Mozambique
-
 Myanmar
-
 Namibia
-
 Nepal
-
 Netherlands
-
 New Zealand
-
 Nigeria
-
 North Macedonia
-
 Norway
-
 Oman
-
 Pakistan
-
 Palestine
-
 Panama
-
 Papua New Guinea
-
 Paraguay
-
 Peru
-
 Philippines
-
 Poland
-
 Portugal
-
 Puerto Rico
-
 Qatar
-
 Reunion
-
 Romania
-
 Rwanda
-
 Saudi Arabia
-
 Serbia
-
 Singapore
-
 Slovakia
-
 Slovenia
-
 Somalia
-
 South Africa
-
 Spain
-
 Sri Lanka
-
 Sweden
-
 Switzerland
-
 Syria
-
 Taiwan
-
 Tajikistan
-
 Tanzania
-
 Thailand
-
 Trinidad and Tobago
-
 Tunisia
-
 Turkey
-
 UAE
-
 Uganda
-
 Ukraine
-
 United Kingdom
-
United States
-
 Uruguay
-
 Uzbekistan
-
 Venezuela
-
 Vietnam
-
 Yemen
-
 Zambia
-
 Zimbabwe
- Forex
- Crypto












