

Tilray shares technical analysis: Persistent downside momentum with $2.16 support in focus

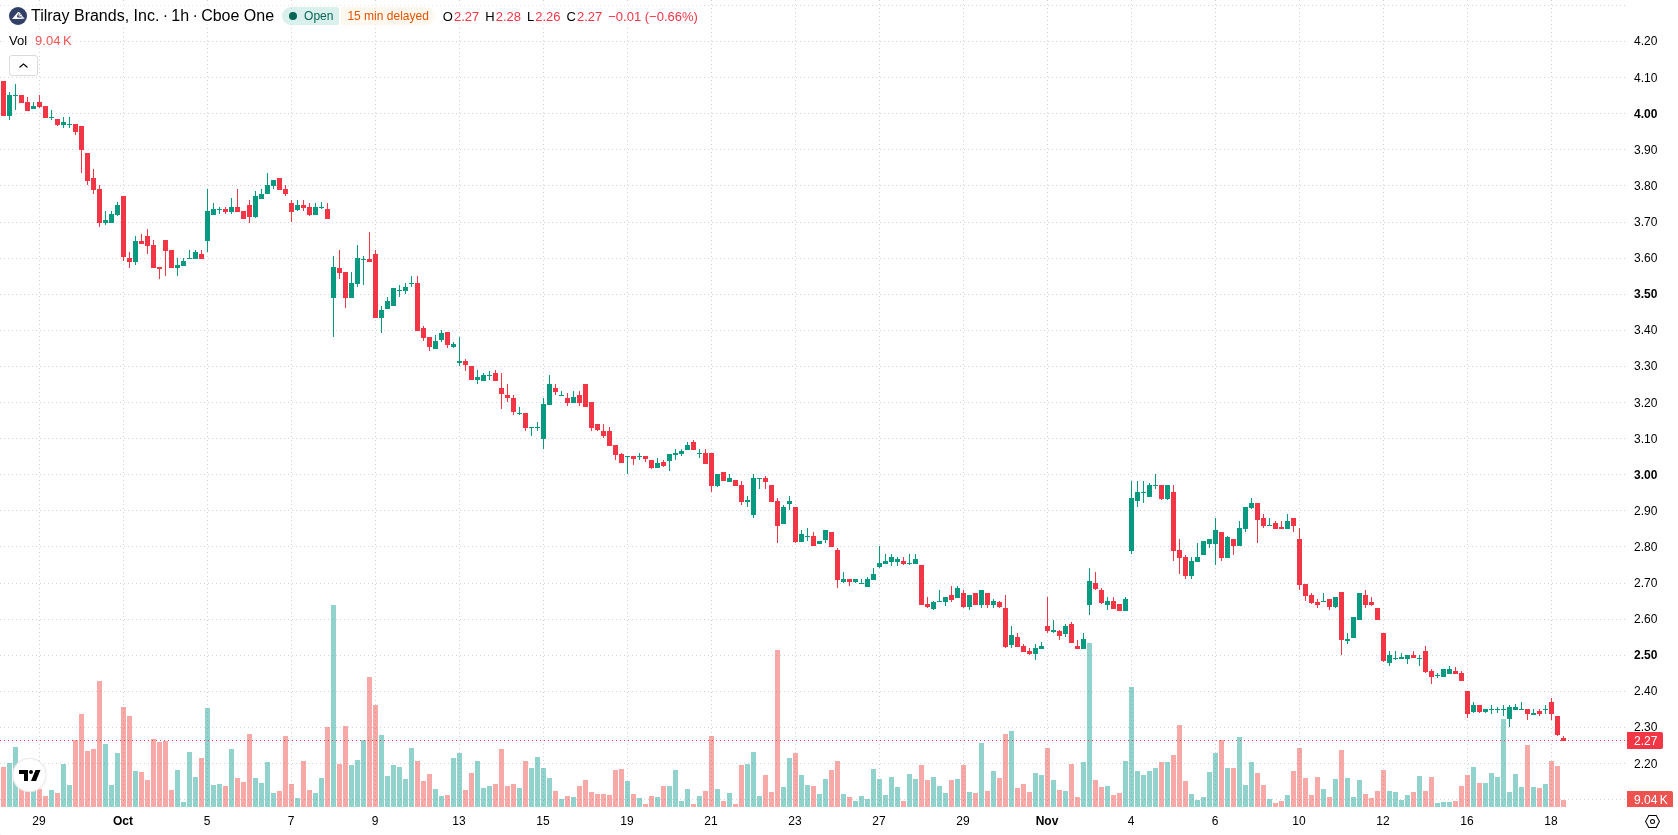
Tilray Inc. (TLRY) stock is trading at $2.26, marking a decline of 3.71% for the day. The price remains below its key moving averages, reflecting prevailing downside momentum.
 2.39
2.55
Highlights
- TLRY/USD trades below key moving averages on all timeframes, indicating sustained bearish momentum.
- Price closed at $2.26, down 3.71% today with moderate volatility and session close near the low.
- The projected range for upcoming sessions is $2.16 to $2.36, with downside risk dominating over potential rebound.
Weak momentum and mixed oscillator signals under key resistance
On the H1 timeframe, TLRY is trading below H1 SMA-20 at $2.38 and H1 SMA-50 at $2.55, while on the D1 timeframe, it remains well under D1 SMA-200 at $5.12. The Ichimoku Kijun level at $2.42 serves as immediate resistance. MACD is on Strong Sell and ADX is on Sell, highlighting weak momentum. RSI has entered the oversold zone, which may indicate selling exhaustion, while Stoch RSI is in the overbought area, pointing to potential short-term overheating. CCI reads as neutral, Bull/Bear Power is slightly negative at -0.01, and the Awesome Oscillator is neutral. Oscillator signals are mixed overall, but intraday dynamics align with persistent downside momentum.
Downside favored as limited rebound caps short-term range
In the short term, TLRY is expected to trade within a $2.16 to $2.36 range based on typical volatility. The probability of an upward move is very low, while further downside remains significantly more likely. Sideways trading in this range is the baseline scenario; a rebound would require a breakout above $2.42, whereas a drop below $2.16 would reinforce the ongoing downtrend.
Previously it was reported that Tilray continued to face persistent technical pressure amid a prevailing bearish outlook. The latest price action and mixed oscillator signals reinforce the downside scenario, with $2.16 now serving as a critical level for traders to monitor for further potential weakness.






Latest Tilray Brands News




-
 Afghanistan
-
 Albania
-
 Algeria
-
 Angola
-
 Argentina
-
 Armenia
-
 Australia
-
 Austria
-
 Azerbaijan
-
 Bahamas
-
 Bahrain
-
 Bangladesh
-
 Belarus
-
 Belgium
-
 Bolivia
-
 Botswana
-
 Brazil
-
 Brunei
-
 Bulgaria
-
 Cambodia
-
 Cameroon
-
 Canada
-
 Chile
-
 China
-
 Colombia
-
 Congo
-
 Costa Rica
-
 Cote d'Ivoire
-
 Croatia
-
 Cuba
-
 Cyprus
-
 Czechia
-
 DR Congo
-
 Denmark
-
 Dominican Republic
-
 Ecuador
-
 Egypt
-
 El Salvador
-
 Estonia
-
 Eswatini
-
 Ethiopia
-
 Finland
-
 France
-
 Georgia
-
 Germany
-
 Ghana
-
 Greece
-
 Haiti
-
 Hong Kong
-
 Hungary
-
 India
-
 Indonesia
-
 Iran, Islamic republic
-
 Iraq
-
 Ireland
-
 Israel
-
 Italy
-
 Jamaica
-
 Japan
-
 Jordan
-
 Kazakhstan
-
 Kenya
-
 Korea
-
 Kuwait
-
 Kyrgyzstan
-
 Laos
-
 Latvia
-
 Lebanon
-
 Lesotho
-
 Libya
-
 Lithuania
-
 Luxembourg
-
 Madagascar
-
 Malaysia
-
 Malta
-
 Mauritius
-
 Mexico
-
 Moldova
-
 Mongolia
-
 Montenegro
-
 Morocco
-
 Mozambique
-
 Myanmar
-
 Namibia
-
 Nepal
-
 Netherlands
-
 New Zealand
-
 Nigeria
-
 North Macedonia
-
 Norway
-
 Oman
-
 Pakistan
-
 Palestine
-
 Panama
-
 Papua New Guinea
-
 Paraguay
-
 Peru
-
 Philippines
-
 Poland
-
 Portugal
-
 Puerto Rico
-
 Qatar
-
 Reunion
-
 Romania
-
 Rwanda
-
 Saudi Arabia
-
 Serbia
-
 Singapore
-
 Slovakia
-
 Slovenia
-
 Somalia
-
 South Africa
-
 Spain
-
 Sri Lanka
-
 Sweden
-
 Switzerland
-
 Syria
-
 Taiwan
-
 Tajikistan
-
 Tanzania
-
 Thailand
-
 Trinidad and Tobago
-
 Tunisia
-
 Turkey
-
 UAE
-
 Uganda
-
 Ukraine
-
 United Kingdom
-
United States
-
 Uruguay
-
 Uzbekistan
-
 Venezuela
-
 Vietnam
-
 Yemen
-
 Zambia
-
 Zimbabwe
- Forex
- Crypto












