

Accenture stock falls as seller pressure dominates the market

Accenture PLC (ACN) stock is trading at $229.93, down 3.91% on the day in a highly volatile session. The price has moved lower, sitting beneath its recent short- and medium-term key moving averages, while remaining above long-term trend levels.
 238.43
256.60
Highlights
- Enterprises are delaying technology investments and shifting consulting budgets, pressuring near-term demand for Accenture stock.
- Generative AI adoption is compressing professional services pricing, increasing uncertainty for Accenture's revenue outlook.
- Shares of Accenture fell 3.91% to $229.93 with strong selling pressure; technical signals forecast a $221.01 to $238.07 trading range and high probability of further downside.
Weakening consulting demand as global tech caution and AI reshape budgets
Accenture continues to face persistent headwinds as enterprises worldwide adopt a more cautious approach to technology spending, leading to the reprioritization of consulting budgets and extended sales cycles. This environment, combined with the rapid adoption of generative AI, has accelerated pricing pressure and contributed to the deflation of traditional billing models for professional services. These developments have dampened demand for Accenture's consulting offerings and increased uncertainty around near-term revenue growth.
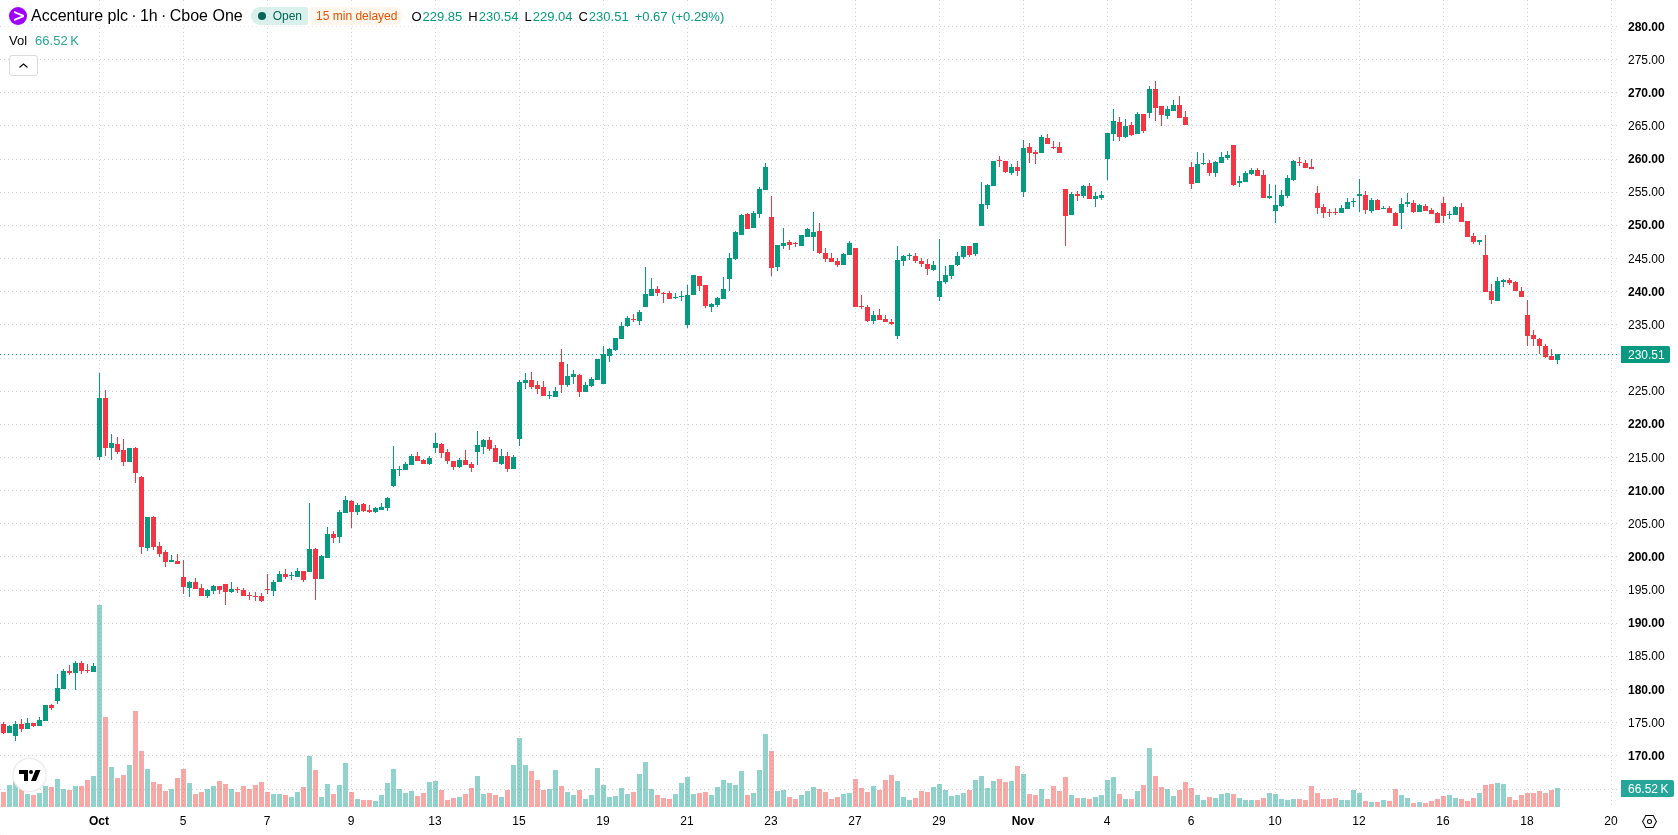
Intact long-term support as intraday selling and oversold signals clash
On the hourly chart, ACN/USD trades below the H1 SMA-20 at $245.34 and the H1 SMA-50 at $250.8, confirming weakness in both short- and medium-term trend structures. The price remains above the D1 SMA-200 at $190.13, indicating intact longer-term support. The Ichimoku Kijun at $243.15 marks an immediate resistance level. MACD and ADX both point to ongoing seller momentum, with Bull/Bear Power at -6.85 also confirming strong intraday selling. RSI, Stochastic RSI, and CCI are all reading oversold, suggesting substantial selling exhaustion, though no reversal is confirmed. The Awesome Oscillator also supports dominant bearish momentum.
Limited rebound prospects as bearish momentum drives near-term consolidation
Over the next several sessions, price action is expected to remain volatile within a forecast range of $221.01 to $238.07. The probability of an immediate rebound remains low due to persistent bearish momentum, while continued downside carries a higher likelihood. The base scenario is for price to consolidate within this band, with a bullish reversal requiring a sustained breakout above $243.15, and further weakening likely if support at $221.01 is breached.
Previously it was reported that Accenture secured a multi-year partnership with Qantas, taking over certain corporate functions as the airline restructures its operations in response to technological change. The current technical picture underscores persistent bearish momentum and heightened volatility, making the $221.01 support level crucial to monitor for potential further downside risk.






Latest Accenture News





-
 Afghanistan
-
 Albania
-
 Algeria
-
 Angola
-
 Argentina
-
 Armenia
-
 Australia
-
 Austria
-
 Azerbaijan
-
 Bahamas
-
 Bahrain
-
 Bangladesh
-
 Belarus
-
 Belgium
-
 Bolivia
-
 Botswana
-
 Brazil
-
 Brunei
-
 Bulgaria
-
 Cambodia
-
 Cameroon
-
 Canada
-
 Chile
-
 China
-
 Colombia
-
 Congo
-
 Costa Rica
-
 Cote d'Ivoire
-
 Croatia
-
 Cuba
-
 Cyprus
-
 Czechia
-
 DR Congo
-
 Denmark
-
 Dominican Republic
-
 Ecuador
-
 Egypt
-
 El Salvador
-
 Estonia
-
 Eswatini
-
 Ethiopia
-
 Finland
-
 France
-
 Georgia
-
 Germany
-
 Ghana
-
 Greece
-
 Haiti
-
 Hong Kong
-
 Hungary
-
 India
-
 Indonesia
-
 Iran, Islamic republic
-
 Iraq
-
 Ireland
-
 Israel
-
 Italy
-
 Jamaica
-
 Japan
-
 Jordan
-
 Kazakhstan
-
 Kenya
-
 Korea
-
 Kuwait
-
 Kyrgyzstan
-
 Laos
-
 Latvia
-
 Lebanon
-
 Lesotho
-
 Libya
-
 Lithuania
-
 Luxembourg
-
 Madagascar
-
 Malaysia
-
 Malta
-
 Mauritius
-
 Mexico
-
 Moldova
-
 Mongolia
-
 Montenegro
-
 Morocco
-
 Mozambique
-
 Myanmar
-
 Namibia
-
 Nepal
-
 Netherlands
-
 New Zealand
-
 Nigeria
-
 North Macedonia
-
 Norway
-
 Oman
-
 Pakistan
-
 Palestine
-
 Panama
-
 Papua New Guinea
-
 Paraguay
-
 Peru
-
 Philippines
-
 Poland
-
 Portugal
-
 Puerto Rico
-
 Qatar
-
 Reunion
-
 Romania
-
 Rwanda
-
 Saudi Arabia
-
 Serbia
-
 Singapore
-
 Slovakia
-
 Slovenia
-
 Somalia
-
 South Africa
-
 Spain
-
 Sri Lanka
-
 Sweden
-
 Switzerland
-
 Syria
-
 Taiwan
-
 Tajikistan
-
 Tanzania
-
 Thailand
-
 Trinidad and Tobago
-
 Tunisia
-
 Turkey
-
 UAE
-
 Uganda
-
 Ukraine
-
 United Kingdom
-
United States
-
 Uruguay
-
 Uzbekistan
-
 Venezuela
-
 Vietnam
-
 Yemen
-
 Zambia
-
 Zimbabwe
- Forex
- Crypto












