

Senator Warren antitrust spotlight coincides with Cigna stock pressure below key averages

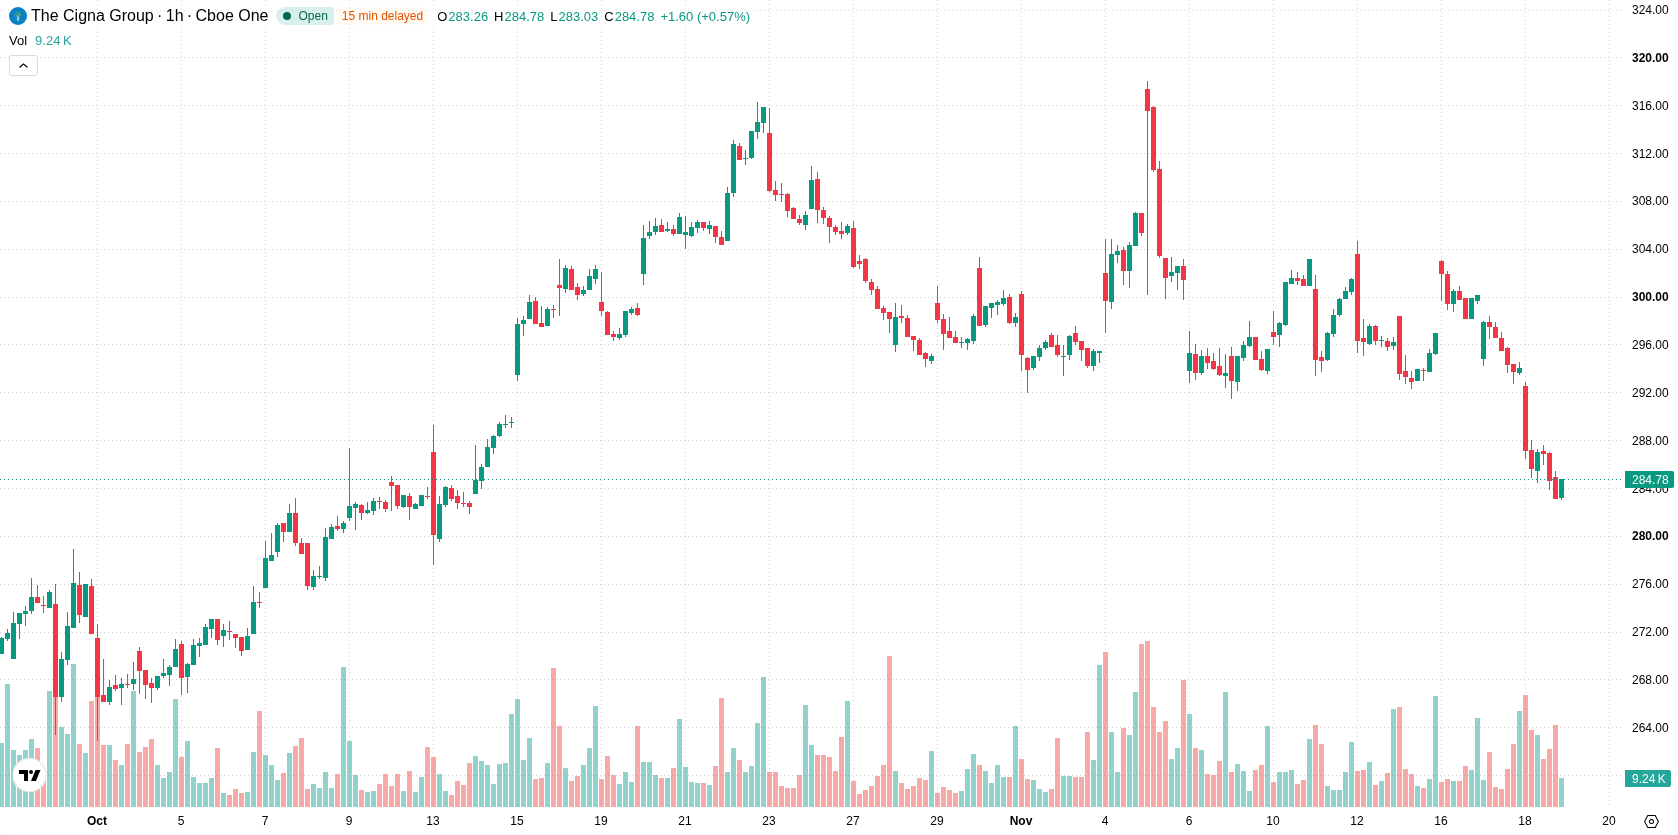
Cigna (CI) stock is trading at $283.88, down 3.46% on the day. The price is currently below its key short- and medium-term moving averages but remains above its longer-term baseline, reflecting ongoing downside pressure within the prevailing session.
 292.93
303.89
Highlights
- Senator Elizabeth Warren publicly called for breaking up major healthcare conglomerates, directly naming The Cigna Group as a target.
- Growing regulatory scrutiny creates significant uncertainty for Cigna's strategy and may alter the industry's competitive landscape.
- Shares of Cigna declined 3.46% today, with technical indicators confirming bearish pressure and an expected trading range of $278.74 to $289.02 in the near term.
Breakup calls heighten regulatory risk for healthcare giants
Senator Elizabeth Warren publicly urged the breakup of major healthcare conglomerates, directly naming The Cigna Group along with other industry leaders, according to Benzinga. This call spotlights mounting concerns around healthcare consolidation and the role large firms play in capturing value across all segments of the industry. The heightened regulatory focus introduces elevated uncertainty for Cigna's corporate strategy and future market structure.
Persistent resistance and bearish momentum limit rebound potential
The price is currently below the H1 SMA-20 at $296.64 and the H1 SMA-50 at $296.99, highlighting persistent short- and medium-term resistance levels. However, CI remains above the D1 SMA-200 at $283.07, providing a degree of longer-term support. The Ichimoku Kijun at $296.85 acts as immediate resistance for rebound attempts. Technical momentum remains bearish, as both MACD and ADX signals indicate continued selling pressure, which is further confirmed by the Awesome Oscillator. RSI currently sits in the neutral zone, while both Stochastic RSI and CCI are in oversold territory, suggesting a possibility of short-term exhaustion but not a reversal. Intraday, Bull/Bear Power reads -2.6 and the price is near session lows amid moderate volatility, reflecting ongoing seller dominance and aligning with broader technical momentum, while mixed oscillators hint at possible, but not yet confirmed, near-term rebound potential.
Further downside likely as rangebound action dominates outlook
Over the next several trading sessions, CI is forecast to trade within the $278.74 to $289.02 range, reflecting a typical volatility band relative to current levels. The most probable scenario is further downside to test support, with any sustained move higher considered low probability unless the price breaks above near-term resistance. The baseline expectation is for rangebound action, unless a decisive technical catalyst shifts the price outside these boundaries.
Previously it was reported that Cigna raised its long-term profit outlook as it refocused its business on employer coverage and pharmacy benefits, while scaling back exposure to government-backed health plans. With mounting regulatory scrutiny now adding to technical downside pressure, the key risk for traders is a potential acceleration of volatility if Cigna decisively breaks below its long-term support near the D1 SMA-200.






Latest Cigna News





-
 Afghanistan
-
 Albania
-
 Algeria
-
 Angola
-
 Argentina
-
 Armenia
-
 Australia
-
 Austria
-
 Azerbaijan
-
 Bahamas
-
 Bahrain
-
 Bangladesh
-
 Belarus
-
 Belgium
-
 Bolivia
-
 Botswana
-
 Brazil
-
 Brunei
-
 Bulgaria
-
 Cambodia
-
 Cameroon
-
 Canada
-
 Chile
-
 China
-
 Colombia
-
 Congo
-
 Costa Rica
-
 Cote d'Ivoire
-
 Croatia
-
 Cuba
-
 Cyprus
-
 Czechia
-
 DR Congo
-
 Denmark
-
 Dominican Republic
-
 Ecuador
-
 Egypt
-
 El Salvador
-
 Estonia
-
 Eswatini
-
 Ethiopia
-
 Finland
-
 France
-
 Georgia
-
 Germany
-
 Ghana
-
 Greece
-
 Haiti
-
 Hong Kong
-
 Hungary
-
 India
-
 Indonesia
-
 Iran, Islamic republic
-
 Iraq
-
 Ireland
-
 Israel
-
 Italy
-
 Jamaica
-
 Japan
-
 Jordan
-
 Kazakhstan
-
 Kenya
-
 Korea
-
 Kuwait
-
 Kyrgyzstan
-
 Laos
-
 Latvia
-
 Lebanon
-
 Lesotho
-
 Libya
-
 Lithuania
-
 Luxembourg
-
 Madagascar
-
 Malaysia
-
 Malta
-
 Mauritius
-
 Mexico
-
 Moldova
-
 Mongolia
-
 Montenegro
-
 Morocco
-
 Mozambique
-
 Myanmar
-
 Namibia
-
 Nepal
-
 Netherlands
-
 New Zealand
-
 Nigeria
-
 North Macedonia
-
 Norway
-
 Oman
-
 Pakistan
-
 Palestine
-
 Panama
-
 Papua New Guinea
-
 Paraguay
-
 Peru
-
 Philippines
-
 Poland
-
 Portugal
-
 Puerto Rico
-
 Qatar
-
 Reunion
-
 Romania
-
 Rwanda
-
 Saudi Arabia
-
 Serbia
-
 Singapore
-
 Slovakia
-
 Slovenia
-
 Somalia
-
 South Africa
-
 Spain
-
 Sri Lanka
-
 Sweden
-
 Switzerland
-
 Syria
-
 Taiwan
-
 Tajikistan
-
 Tanzania
-
 Thailand
-
 Trinidad and Tobago
-
 Tunisia
-
 Turkey
-
 UAE
-
 Uganda
-
 Ukraine
-
 United Kingdom
-
United States
-
 Uruguay
-
 Uzbekistan
-
 Venezuela
-
 Vietnam
-
 Yemen
-
 Zambia
-
 Zimbabwe
- Forex
- Crypto












