Is Google Undervalued Or Overvalued After The Market Crash?


Editorial Note: While we adhere to strict Editorial Integrity, this post may contain references to products from our partners. Here's an explanation for How We Make Money. None of the data and information on this webpage constitutes investment advice according to our Disclaimer.
Google's current valuation reflects high expectations from AI, cloud growth, and sustained ad revenue. While the fundamentals remain strong, risks like regulatory pressure, slowing ad growth, and rising competition from Microsoft could challenge these assumptions. With the stock priced close to perfection, even small earnings misses could trigger sharper reactions.
To understand whether Google is truly overvalued, it helps to look past headline numbers like P/E or market cap and focus on how its core businesses are performing. Search, YouTube, and Ads still generate strong cash flow, but they now face slower growth and rising competition. Cloud continues to scale and AI tools add excitement, yet margins are tightening and regulatory pressure is building. Investors are treating Google as if earnings can rise without interruption, although its once-dominant position is now facing more challenges. The business remains strong, but the current price may be moving ahead of the fundamentals.
In this article, we break down Google’s core financials, valuation metrics, market trends, and analyst sentiment to help you decide whether this tech titan is priced for perfection or headed for a reality check.
Understanding Google
Google, or more accurately its parent company Alphabet, is one of the most dominant names in global tech. With a massive lead in online search, advertising, and a growing portfolio in cloud computing and AI, its stock has long been a favorite among institutional investors and retail traders alike. But with its market cap soaring past $2 trillion and shares hitting all-time highs in 2025, a critical question is back in focus. Is Google overvalued?
This is not just about headline numbers or quarterly earnings. It is about whether Google can keep delivering the kind of growth that justifies its premium price tag. As competition intensifies from Microsoft in AI and Amazon in cloud, and with ad spending facing macro headwinds, investors are starting to wonder if the current price reflects future reality or past dominance.
Google's current market position
Google is more than a search engine. It is the foundation of Alphabet Inc., a global technology company that operates across search, advertising, cloud services, hardware, and AI. To understand how much Google is worth, it helps to look at where the business stands today, in both its operations and the way the market values it.

Overview of Alphabet Inc. and its subsidiaries
Alphabet was created in 2015 to better organize Google’s sprawling operations. It separates the main cash-generating businesses from long-term innovation projects under distinct subsidiaries.
Major parts of Alphabet today:
Google Services. This includes Search, YouTube, Google Play, Maps, and Gmail, the biggest source of Alphabet’s ad revenue and profits.
Google Cloud. Now the third-largest cloud provider globally behind Amazon and Microsoft, Google Cloud has become a fast-growing revenue stream.
YouTube. With over 2.5 billion monthly users, YouTube is both a social platform and a major ad engine, contributing more than $40 billion in annual revenue.
Other Bets. This segment includes Waymo (self-driving cars), Verily (life sciences), and X (moonshot projects). These operate at a loss but are meant to drive future innovation.
Google’s structure shows it is not dependent on one business line. Search still drives most of the profit, but Alphabet is expanding in cloud and AI. These areas now support its long term strategy and help widen its future revenue base.
Recent stock performance and market capitalization
Alphabet’s stock has been on a strong run over the past 18 months, driven by rising profits, cost cuts, and market enthusiasm for AI. This has put Google back near its all-time highs, with many questioning if it has run too far too fast.
Alphabet’s stock has climbed sharply, helped by strong earnings, cloud growth and market interest in AI. The price now trades near $289, and the company carries a market cap of about $3.49 trillion, which places it among the largest in the world. Over the past year, the stock has gained more than 50%, far ahead of the broader market. The current forward P/E is close to 26x, which is higher than its long term average.
Part of the rise comes from better margins, heavy share buybacks and improved profitability in Google Cloud. AI upgrades across Search and Workspace have also lifted sentiment. These factors show that investors expect steady growth across Google’s main businesses. At the same time, the current price now reflects higher expectations, which leaves less room for weak quarters.
Valuation of Google
To understand Google valuation, it helps to look past the stock chart and review the company’s financial strength, expected earnings and recent price behavior. These areas together show whether the stock is priced fairly or if expectations are running ahead of performance.
Google fundamental analysis
Valuation ratios give investors a quick way to judge if a stock like Google is fairly priced. While these numbers are not the full story, they help flag when expectations might be too high or when a stock is trading at a discount. Here, we break down three key views investors use to assess Google's current valuation and financial position.
Price to earnings (P/E) ratio analysis
Google’s current P/E sits near 28.5x, while the forward P/E is close to 26x, both above its long term average. The company continues to deliver strong profit margins, with earnings expected to grow more than 11% next year based on current estimates. These ratios show that investors are willing to pay a premium for Google’s earnings power, but the price also comes with pressure to maintain steady growth.
Investors are still willing to pay a premium for Google, largely due to its strong cash flow, brand, and AI potential. However, the current ratio does not leave much cushion if earnings growth slows or expectations fall short. The P/E ratio shows confidence, but also pressure to keep delivering strong quarterly results.
Price to earnings growth (PEG) ratio insights
Google’s PEG ratio now stands near 1.7, based on forward earnings growth. A PEG above 1.5 often signals a stock that may be slightly ahead of its growth trend. This ratio suggests steady expansion, but not rapid growth, which means the stock depends on consistent delivery for the current price to hold.
Google is growing, but not at hyper-growth levels anymore. The PEG shows that some of the optimism is already priced in, especially around AI and cloud gains. Google may not be cheap, but it's not wildly overpriced either. If it meets or beats expectations, the valuation can still hold up.
Intrinsic valuation of Google
To check if Google’s stock price matches its real worth, we can use intrinsic valuation methods like discounted cash flow. This helps estimate fair value based on expected earnings and cash flows.
Using updated assumptions of 8 to 10% revenue growth, long term operating margins between 27 and 30%, and steady free cash flow expansion, most valuation models place fair value between $130 and $140 per share. With Google trading near $289 on a pre split adjusted basis, the stock appears to be about 15 to 20% above its long term intrinsic estimate. Other valuation metrics support this picture.
The forward P/E remains close to 26x, slightly above the company’s usual range, and the EV to EBITDA ratio sits near 18x, which is higher than peers like Meta but similar to Microsoft. These readings show that investors are pricing in steady growth from AI and cloud while accepting only a small margin for slower performance. The current valuation bakes in high expectations for AI and cloud growth. The stock may be slightly overvalued unless earnings accelerate faster than expected.
Google technical analysis
Technical analysis gives a snapshot of how traders see the stock in the short term. For Google, momentum has been strong, but signs of overextension are starting to show.
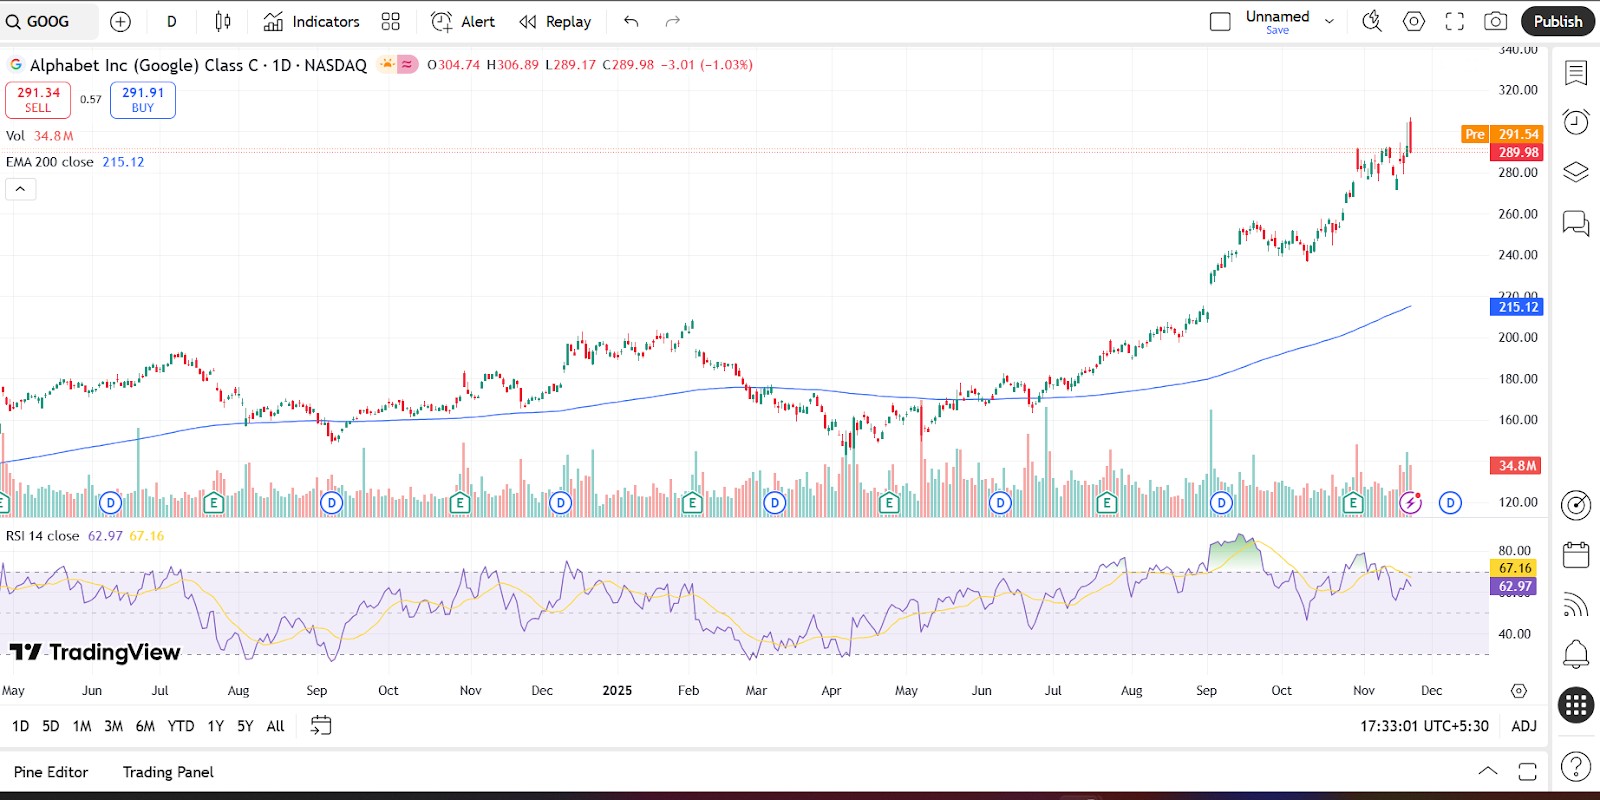
Google’s technical analysis shows a strong uptrend supported by rising momentum and healthy buying interest. The stock trades near $289 to $291, well above the 200 day moving average near $215, which signals a firm long term trend. The RSI sits near 63, indicating positive momentum with some signs of mild overbought pressure, but not extreme enough to signal a reversal on its own. Recent price action shows a breakout to new highs followed by small pullbacks, which is typical of a steady trend rather than a sharp spike.
The stock is in a strong uptrend, but short-term corrections are possible if earnings disappoint or broader tech stocks lose steam.
Analyst perspectives and market sentiment
Analyst sentiment around GOOGL’s valuation remains divided, with most firms acknowledging Alphabet’s strong financial position while also pointing out the rising risks around regulation and competition in AI. Many analysts still see meaningful long term potential in the company’s advertising and cloud businesses, but the recent rally in the stock has made the outlook more sensitive to earnings performance. As the market leans heavily on expected gains from AI and continued cloud expansion, analysts are watching closely to see if Alphabet can deliver steady execution through the next few quarters.
Bullish viewpoints
Supporters of Google’s strategy believe the company is well-positioned for continued dominance in digital advertising, cloud computing, and AI.
Why analysts are optimistic:
AI integration is gaining traction. Analysts at Morgan Stanley and BofA view Google's rollout of generative AI across Search, Gmail, and Workspace as a long-term growth driver that will improve user engagement and monetization.
Cloud turning profitable. After years of heavy investment, Google Cloud is now profitable and growing steadily, adding resilience to Alphabet’s business model.
Strong financial position. With over $110 billion in cash and no urgent debt pressures, analysts see Google as financially secure, giving it room to invest aggressively without hurting balance sheet health.
Share buybacks boost value. Alphabet’s large-scale stock repurchase program is viewed as a shareholder-friendly move that adds upside to earnings per share.
Bulls believe Alphabet has enough financial strength and innovation capacity to keep delivering moderate growth, even in a more competitive environment.
Bearish viewpoints
Despite strong performance, some analysts argue that Google’s current stock price is too high relative to its slowing growth and rising competition.
Concerns raised by skeptics:
Slowing ad revenue growth. Digital ad growth is cooling, especially in mature markets like the U.S. and Europe, which still make up the bulk of Google's revenue.
Increased AI competition. Microsoft’s rapid rollout of AI features through Bing and Azure is seen as a real threat to Google’s dominance in both search and enterprise AI.
Regulatory risks. Alphabet faces ongoing antitrust cases in the U.S. and EU, and stricter regulation could limit its data usage and ad targeting practices.
Valuation stretch. With a forward P/E around 25x, some analysts argue Google is pricing in too much good news, especially when its growth rate is no longer in double digits.
Skeptical analysts see Alphabet as a strong company trading at a price that demands near perfect execution.
We also suggest you take a look at our forecast:
| Year | Price in the middle of the year | Price at the end of the year |
|---|---|---|
| 2026 | $350 | $1000 |
| 2027 | $950 | $900 |
| 2028 | $1200 | $1200 |
| 2029 | $1200 | $1300 |
| 2030 | $1600 | $1700 |
| 2031 | $1600 | $1700 |
| 2032 | $2100 | $2200 |
| 2033 | $2700 | $2700 |
| 2034 | $3800 | $3600 |
| 2035 | $2300 | $2300 |
| 2036 | $3200 | $4200 |
| 2037 | $4400 | $4000 |
| 2038 | $5700 | $6500 |
| 2039 | $9100 | $9200 |
| 2040 | $8800 | $8300 |
Consensus and price targets
Analysts continue to lean positive on Alphabet, but the tone has become more measured after the recent rally. Many firms still see upside based on stable earnings and strong cash flow, but they also note that the stock is now more sensitive to short term performance because expectations are higher than before.
The average analyst target now sits near $325, while the stock trades around $289. About 72% of analysts rate the stock a buy, close to 25% recommend hold, and only a small number list it as a sell. High end targets reach $360, while the lowest estimates remain closer to $250.
Most analysts expect Alphabet to keep growing, but the upside may be more gradual from here because strong results are already priced in. Earnings consistency and disciplined AI execution will be important if the stock is going to hold its current range or push higher.
If you choose to act on your view of the stock after reviewing its valuation, the list of best stock brokers for investing in stocks below can help. It gives you a quick way to compare trusted platforms so you can open an account easily and place your trades with a bit more clarity and control.
| eToro USA | Plus500 | eOption | Revolut | Interactive Brokers | |
|---|---|---|---|---|---|
|
Account min. |
50 | EUR500 | No | No | No |
|
Research and data |
Yes | Yes | Yes | Yes | Yes |
|
Basic stock/ETF fee |
No | $0.006 | $0 | 0.12%-0.25% | 0-0,0035% |
|
Deposit Fee |
No | No | Not specified | No | No |
|
Withdrawal fee |
No | No | Not specified | No charge up to a limit | No |
|
Regulation |
SEC, FINRA | CySEC, FCA, ASIC, FMA, FSCA, FSA Seychelles, EFSA, MAS, DFSA, SCB | FINRA, SIPC | FCA, SEC, FINRA | SEC, FINRA, SIPC, FCA, NSE, BSE, SEBI, SEHK, HKFE, IIROC, ASIC, CFTC, NFA |
|
TU overall score |
8.8 | 8.48 | 7.93 | 8.6 | 8.53 |
|
Open an account |
Go to broker Your capital is at risk. |
Go to broker 80% of retail CFD accounts lose money. |
Study review | Study review | Study review |
Google News

Alphabet faces price target cuts as higher AI spending weighs on shares

Sundar Pichai upbeat on AI expansion but Alphabet trades lower on selling pressure
Reddit shares fall as Google AI content deal renewal faces uncertainty

Alphabet slips toward key support as AI leadership faces renewed selling pressure

Will Alphabet stock break $356.85 resistance as oversold conditions limit downside?

Can Q2 2026 earnings report scheduled July 22 drive Alphabet stock higher?
The hidden risks in Google’s earnings that most people ignore

One thing I have learned from watching Google over the years is that real risks often build quietly, long before they appear in earnings reports. People are changing how they search, how they learn, and where they spend time, and these shifts slowly reshape the strength of Google’s core business. Short video platforms, AI chat tools, and new forms of discovery are already pulling attention away from traditional search. These changes grow slowly but they matter, because they can weaken Google’s advantage before the market fully notices.
I also keep a close eye on Google’s reliance on being the preset choice on billions of devices. It gives the company a huge head start, but it also exposes it to regulatory action that could remove that convenience. If Google is forced to fight for user placement, acquisition costs rise and margins tighten. For investors, the real test is whether Google can adapt quickly enough to protect its lead while these shifts build underneath the surface.
Conclusion
Despite Google's impressive run to near all-time highs, the stock's valuation demands careful scrutiny given intensifying competition and regulatory headwinds. While the company's dominance in search and digital advertising remains strong, slower ad growth and potential disruptions from AI rivals like Microsoft underscore the need for caution. Investors expecting outsized returns may find Google’s current premium price harder to justify unless the company unlocks new growth drivers. Ultimately, buying Google now hinges on belief not just in its existing moat, but in its ability to innovate boldly in a rapidly evolving tech landscape.
FAQs
What are the primary drivers of Google's current high valuation?
How does regulatory risk impact Google's valuation outlook?
What role does competition play in influencing Google’s future growth prospects?
Why might Google’s valuation be more susceptible to market corrections compared to some peers?
Editors' Top Picks and Insights

Brent nears $100: Why oil prices are rising

Gram Wallet launch: Can Telegram bring crypto to the masses?

AI without limits: How dangerous are neural networks?

Worldcoin on Wall Street: From iris scans to ETF

Mark Cuban's wealth philosophy: Why stocks matter more than salary or crypto

Dangerous but indispensable: Why the crypto market needs bridges
Related Articles
Team that worked on the article
Ashutosh Sureka is a finance professional specializing in financial research, credit assessment, and equity analysis.
Dan Blystone began his trading career in 1998 as an arbitrage clerk on the floor of the Chicago Mercantile Exchange (CME). He later traded bond and Eurex futures at proprietary firms such as Altea Trading, gaining valuable experience in high-frequency trading and risk management.
Chinmay Soni is a financial analyst with more than 5 years of experience in working with stocks, Forex, derivatives, and other assets. As a founder of a boutique research firm and an active researcher, he covers various industries and fields, providing insights backed by statistical data.
Index in trading is the measure of the performance of a group of stocks, which can include the assets and securities in it.
Bitcoin is a decentralized digital cryptocurrency that was created in 2009 by an anonymous individual or group using the pseudonym Satoshi Nakamoto. It operates on a technology called blockchain, which is a distributed ledger that records all transactions across a network of computers.
Day trading involves buying and selling financial assets within the same trading day, with the goal of profiting from short-term price fluctuations, and positions are typically not held overnight.
Ethereum is a decentralized blockchain platform and cryptocurrency that was proposed by Vitalik Buterin in late 2013 and development began in early 2014. It was designed as a versatile platform for creating decentralized applications (DApps) and smart contracts.
An investor is an individual, who invests money in an asset with the expectation that its value would appreciate in the future. The asset can be anything, including a bond, debenture, mutual fund, equity, gold, silver, exchange-traded funds (ETFs), and real-estate property.

-
 Afghanistan
-
 Albania
-
 Algeria
-
 Angola
-
 Argentina
-
 Armenia
-
 Australia
-
 Austria
-
 Azerbaijan
-
 Bahamas
-
 Bahrain
-
 Bangladesh
-
 Belarus
-
 Belgium
-
 Bolivia
-
 Botswana
-
 Brazil
-
 Brunei
-
 Bulgaria
-
 Cambodia
-
 Cameroon
-
 Canada
-
 Chile
Chile
-
 China
China
-
 Colombia
-
 Congo
Congo
-
 Costa Rica
-
 Cote d'Ivoire
-
 Croatia
-
 Cuba
Cuba
-
 Cyprus
-
 Czechia
-
 DR Congo
-
 Denmark
-
 Dominican Republic
-
 Ecuador
-
 Egypt
Egypt
-
 El Salvador
-
 Estonia
-
 Eswatini
-
 Ethiopia
-
 Finland
-
 France
-
 Georgia
-
 Germany
-
 Ghana
Ghana
-
 Greece
-
 Haiti
Haiti
-
 Hong Kong
-
 Hungary
-
 India
India
-
 Indonesia
-
 Iran, Islamic republic
-
 Iraq
Iraq
-
 Ireland
-
 Israel
-
 Italy
Italy
-
 Jamaica
-
 Japan
Japan
-
 Jordan
-
 Kazakhstan
-
 Kenya
Kenya
-
 Korea
Korea
-
 Kuwait
-
 Kyrgyzstan
-
 Laos
Laos
-
 Latvia
-
 Lebanon
-
 Lesotho
-
 Libya
Libya
-
 Lithuania
-
 Luxembourg
-
 Madagascar
-
 Malaysia
-
 Malta
Malta
-
 Mauritius
-
 Mexico
-
 Moldova
-
 Mongolia
-
 Montenegro
-
 Morocco
-
 Mozambique
-
 Myanmar
-
 Namibia
-
 Nepal
Nepal
-
 Netherlands
-
 New Zealand
-
 Nigeria
-
 North Macedonia
-
 Norway
-
 Oman
Oman
-
 Pakistan
-
 Palestine
-
 Panama
-
 Papua New Guinea
-
 Paraguay
-
 Peru
Peru
-
 Philippines
-
 Poland
-
 Portugal
-
 Puerto Rico
-
 Qatar
Qatar
-
 Reunion
-
 Romania
-
 Rwanda
-
 Saudi Arabia
-
 Serbia
-
 Singapore
-
 Slovakia
-
 Slovenia
-
 Somalia
-
 South Africa
-
 Spain
Spain
-
 Sri Lanka
-
 Sweden
-
 Switzerland
-
 Syria
Syria
-
 Taiwan
-
 Tajikistan
-
 Tanzania
-
 Thailand
-
 Trinidad and Tobago
-
 Tunisia
-
 Turkey
-
 UAE
UAE
-
 Uganda
-
 Ukraine
-
 United Kingdom
-
United States
-
 Uruguay
-
 Uzbekistan
-
 Venezuela
-
 Vietnam
-
 Yemen
Yemen
-
 Zambia
-
 Zimbabwe
- Forex
- Crypto
