The Best Forex Indicator Combination For Smarter Trading


Editorial Note: While we adhere to strict Editorial Integrity, this post may contain references to products from our partners. Here's an explanation for How We Make Money. None of the data and information on this webpage constitutes investment advice according to our Disclaimer.
While there’s no single best Forex indicator combination, some work better than the others. Stochastic + Bollinger is great for reversals, Keltner + Bollinger helps filter out false signals, and using multiple moving averages (ribbon) confirms trends and momentum shifts. Each combo suits different styles — pick based on your strategy.
Forex trading indicators are essential tools for traders to study market changes, spot price patterns, and estimate where the market is heading. They help traders trade with confidence, cut down on guesswork, and make smarter trades. However, no single indicator provides all the answers. This is why traders use a combination of indicators to avoid misleading trade setups and improve reliability. In this guide, we will explore different types of Forex indicators, discuss how to choose the best combination for different trading styles, and provide practical strategies for traders at all levels.
What is the best Forex indicator combination?
Well, there’s no one-size-fits-all, but a few combinations consistently stand out for different trading styles:
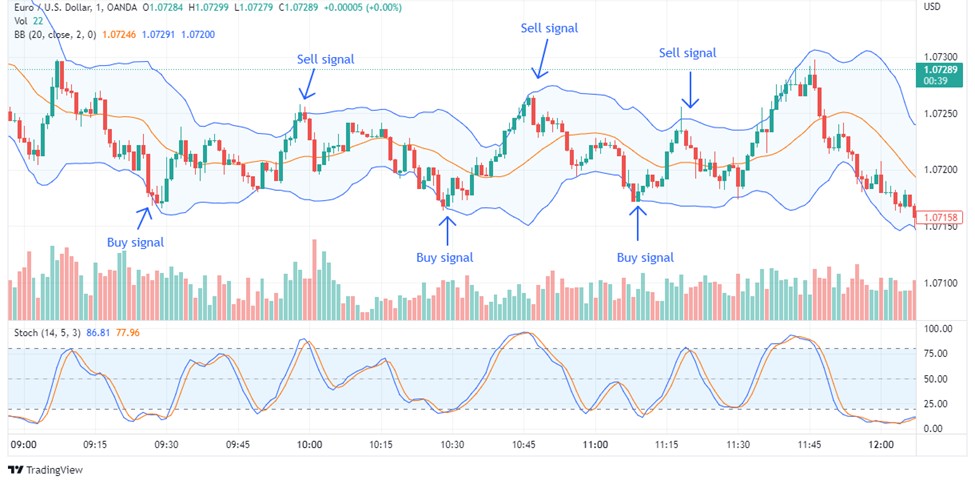
Stochastic and Bollinger work great together when you're looking for reversal points. Bollinger Bands show volatility and price extremes, while the Stochastic helps spot overbought or oversold zones — making it easier to time entries.
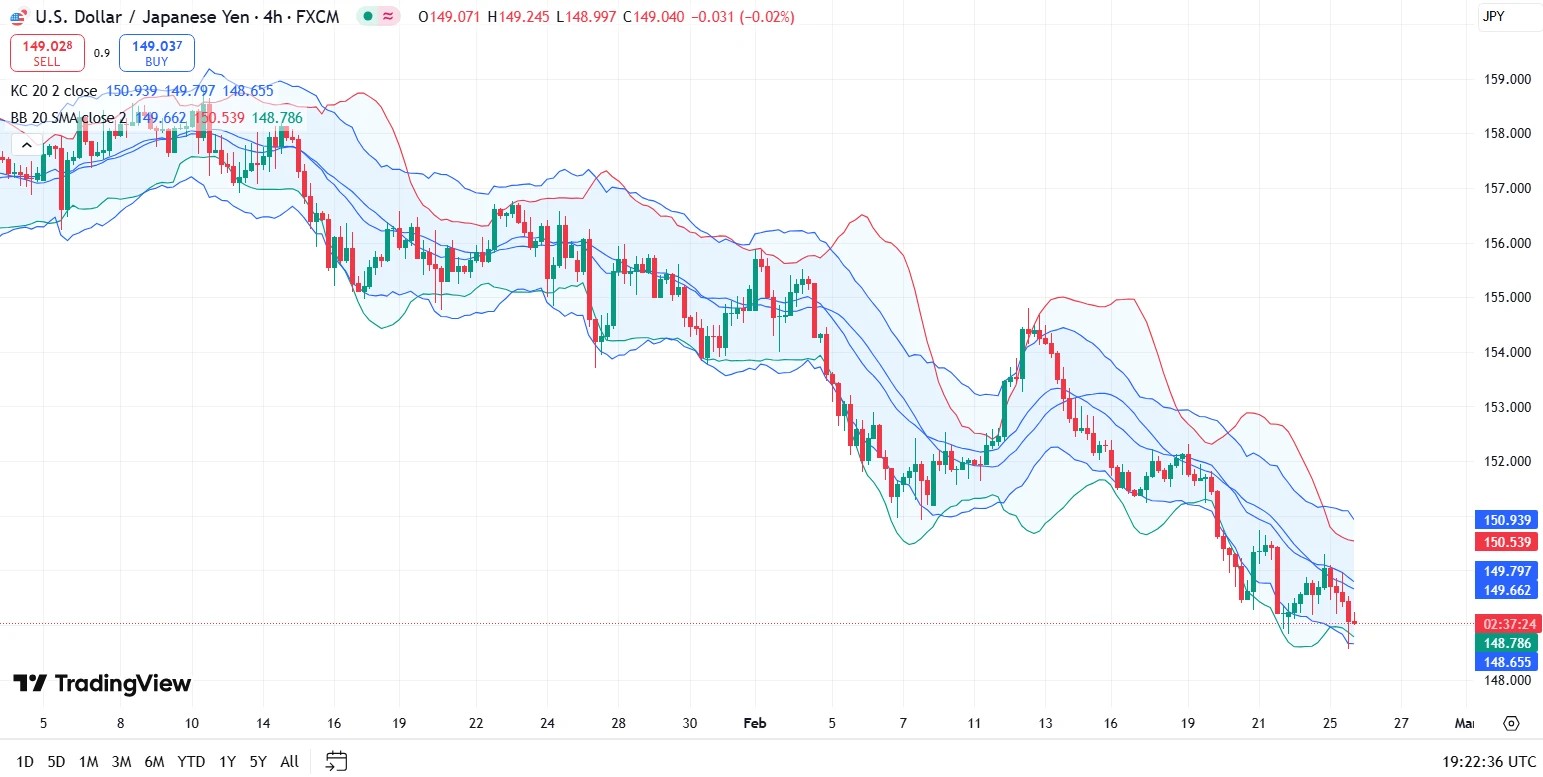
Keltner and Bollinger is a strong combo for breakout traders. Taking the lower bound between the two, traders can get better signals for when the price is to reverse.
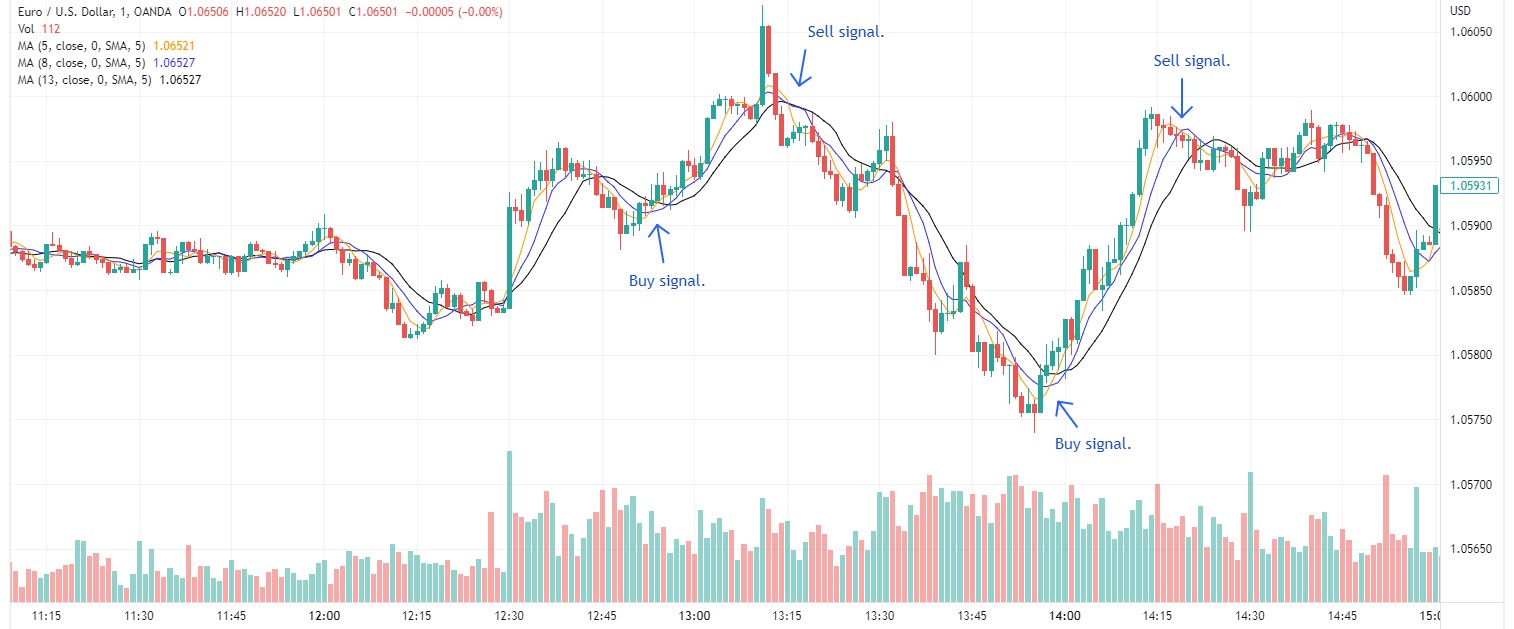
Multiple Moving Averages (Ribbon) is ideal for spotting trends and momentum shifts. When the ribbon fans out and moves in one direction, it shows strong trend strength. It’s especially useful for identifying early entries and exits with less noise.
Ultimately, the best combo depends on your trading goals — but these three are popular for good reason.
Choosing the right indicators
Now, the question is, which would be the right tool to pick? You can narrow down this thought by considering the following aspects:
How you trade matters. Quick traders need rapid signals like VWAP and RSI, while swing traders rely on Moving Averages and MACD.
Trend tools shine in moving markets. They work well when prices follow a clear direction, but struggle in sideways conditions.
Range-bound markets need oscillators. When prices move within a set range, tools like RSI and Stochastic provide better signals.
Double-check trends before trading. Conservative traders prefer indicators that confirm direction before entering a position. The Traders Dynamic Index (TDI) helps you see momentum and trend strength in one glance by blending RSI, moving averages, and volatility bands.
Keeping it simple yet effective. The right mix should provide clear signals without overcomplicating decisions.
Some other popular Forex indicator combinations
Trend confirmation combo: Moving Average + RSI + Volume
This combination helps traders identify trends and confirm momentum.
How to use it:
Use Moving Averages (EMA or SMA) to determine trend direction.
RSI confirms if the trend has strong momentum.
Volume validates the trend’s strength before entering a trade.
Reversal and breakout strategy: Bollinger Bands + MACD + Stochastic
Ideal for identifying reversals and breakout opportunities.
How to use it:
Watch for Bollinger Bands expansion to signal volatility.
MACD crossovers confirm momentum shifts.
Stochastic indicates overbought/oversold conditions for precise entries.
Trend and momentum strategy: Fibonacci retracement + MACD + Parabolic SAR
This strategy identifies retracement levels and confirms trend continuation.
How to use it:
Use Fibonacci levels to find price pullback zones.
MACD confirms whether the trend will continue.
Parabolic SAR helps in determining entry and exit points.
Common mistakes when combining indicators

Many traders unknowingly sabotage their strategies by misusing indicators — here’s how to avoid costly mistakes and make smarter trading decisions.
Stop using indicators that tell you the same thing. Many traders combine RSI, Stochastic, and MACD, not realizing they all measure momentum. Using multiple indicators that serve the same purpose leads to redundancy, not better accuracy. Instead, pair indicators that complement each other, like a trend indicator with a volume-based one.
Avoid forcing signals from mismatched timeframes. A moving average crossover on a 5-minute chart won’t mean much if your confirmation indicator is on the 1-hour timeframe. Mismatched timeframes create false confidence, leading to bad entries and exits. Always make sure your indicators are working within the same timeframe or supporting each other logically.
Don’t ignore volume — it confirms your indicators. Many traders rely only on price-based indicators, missing out on the power of volume. An RSI overbought signal means little if volume isn’t decreasing. Volume tells you whether a trend is strong or likely to fade, making it a crucial filter for confirming indicator signals.
Overcomplicating charts will make you second-guess trades. Adding too many indicators creates clutter and conflicting signals. If your chart looks like a mess of lines and colors, you’ll hesitate and overanalyze instead of acting. Keep it simple — three to four well-chosen indicators are more effective than a dozen that confuse you.
Don’t overlook the importance of using the right broker. No matter how good your strategy is, it won’t matter if your broker lacks proper charting features or restricts access to key tools. Using a platform with limited technical indicators, poor execution, or laggy performance will only hurt your results.
To trade effectively, you need a broker that offers a smooth experience and access to powerful analysis features. We have presented below a table list of top brokers that provide access to a wide range of technical analysis tools. You can compare them and choose the best one for yourself:
| Demo | Min. deposit, $ | Max. leverage | Deposit fee, % | Withdrawal fee, $ | Regulation | TradingView | MT5 | Autochartist | Open an account | |
|---|---|---|---|---|---|---|---|---|---|---|
| Yes | 100 | 1:300 | No | No | FCA, CySEC, MAS, ASIC, FMA, FSA (Seychelles) | Yes | No | No | Open an account Your capital is at risk. |
|
| Yes | No | 1:500 | No | No | ASIC, FCA, DFSA, BaFin, CMA, SCB, CySec | Yes | Yes | Yes | Open an account Your capital is at risk.
|
|
| Yes | No | 1:200 | No | 0-15 | FSC (BVI), ASIC, IIROC, FCA, CFTC, NFA | Yes | Yes | Yes | Open an account Your capital is at risk. |
|
| Yes | 100 | 1:50 | No | No | CIMA, FCA, FSA (Japan), NFA, IIROC, ASIC, CFTC | Yes | Yes | Yes | Study review | |
| Yes | No | 1:30 | No | Yes | SEC, FINRA, SIPC, FCA, NSE, BSE, SEBI, SEHK, HKFE, IIROC, ASIC, CFTC, NFA | Yes | No | No | Open an account Your capital is at risk. |
Why trust us
We at Traders Union have analyzed financial markets for over 14 years, evaluating brokers based on 250+ transparent criteria, including security, regulation, and trading conditions. Our expert team of over 50 professionals regularly updates a Watch List of 500+ brokers to provide users with data-driven insights. While our research is based on objective data, we encourage users to perform independent due diligence and consult official regulatory sources before making any financial decisions.
Learn more about our methodology and editorial policies.
Using adaptive and volume-based indicators to improve trade accuracy

Most traders make the mistake of choosing indicators based on popularity rather than function, leading to redundancy and conflicting signals. The key is understanding how indicators interact with market conditions. For example, combining a trend indicator like the 200-day Moving Average with a volume-based indicator like On-Balance Volume (OBV) can confirm whether price movements have real strength behind them.
Many traders rely on price-based signals alone, but without volume confirmation, they might enter weak trends that fizzle out. Beginners should focus on combinations that validate each other rather than repeat the same type of information.
Another overlooked approach is using adaptive indicators that change with market conditions. Static indicators like RSI and MACD have fixed parameters that might not work in different market phases. Instead, traders can use tools like the Adaptive Moving Average (AMA) or Kaufman’s Adaptive Moving Average (KAMA), which adjust dynamically to volatility.
This prevents lagging signals in fast-moving markets and excessive noise in choppy conditions. The biggest mistake beginners make is assuming one setup works in all conditions — adaptive indicators help traders adjust their strategy based on the market environment.
Conclusion
No single Forex indicator guarantees success, but combining complementary indicators improves accuracy. Whether you prefer trend-following, momentum-based, or volatility-focused strategies, choosing the right combination based on your trading style and market conditions is essential. Backtesting, demo trading, and continuous refinement will help you find the best approach for long-term profitability.
FAQs
What is the best Forex indicator combination for beginners?
A simple yet effective combination for beginners includes Moving Averages (SMA/EMA), RSI, and MACD. This setup helps identify trends, measure momentum, and confirm trade signals, reducing confusion while learning the basics.
Can too many indicators affect trading performance?
Yes, using too many indicators can lead to conflicting signals and overcomplicated analysis. It's best to use 2–3 complementary indicators that provide clear insights without redundancy.
How do I know if my indicator combination is effective?
Backtesting on historical data and demo trading can help assess an indicator combination's accuracy. If it consistently improves decision-making and trade success, it's effective for your strategy.
Should I adjust my indicator combination for different market conditions?
Yes, trending markets require trend-following indicators like Moving Averages, while ranging markets work better with oscillators like RSI or Stochastic. Adapting to market conditions improves trade accuracy.
Related Articles
Team that worked on the article
Alamin Morshed is a contributor at Traders Union. He specializes in writing articles for businesses that want to improve their Google search rankings to compete with their competition. With expertise in search engine optimization (SEO) and content marketing, he ensures his work is both informative and impactful.
Chinmay Soni is a financial analyst with more than 5 years of experience in working with stocks, Forex, derivatives, and other assets. As a founder of a boutique research firm and an active researcher, he covers various industries and fields, providing insights backed by statistical data. He is also an educator in the field of finance and technology.
As an author for Traders Union, he contributes his deep analytical insights on various topics, taking into account various aspects.
Mirjan Hipolito is a journalist and news editor at Traders Union. She is an expert crypto writer with five years of experience in the financial markets. Her specialties are daily market news, price predictions, and Initial Coin Offerings (ICO).
Ranging markets are a type of market characterized by short-term movement between apparent asset price highs and lows.
Backtesting is the process of testing a trading strategy on historical data. It allows you to evaluate the strategy's performance in the past and identify its potential risks and benefits.
The Stochastic Oscillator is a technical indicator used in financial analysis to gauge the momentum of a security's price and identify overbought or oversold conditions by comparing the closing price to a specified price range over a defined period.
Forex leverage is a tool enabling traders to control larger positions with a relatively small amount of capital, amplifying potential profits and losses based on the chosen leverage ratio.
Cryptocurrency is a type of digital or virtual currency that relies on cryptography for security. Unlike traditional currencies issued by governments (fiat currencies), cryptocurrencies operate on decentralized networks, typically based on blockchain technology.


-
 Afghanistan
-
 Albania
-
 Algeria
-
 Argentina
-
 Armenia
-
 Australia
-
 Austria
-
 Azerbaijan
-
 Bahamas
-
 Bahrain
-
 Bangladesh
-
 Belgium
-
 Botswana
-
 Brazil
-
 Brunei
-
 Bulgaria
-
 Burma
Burma
-
 Cambodia
-
 Cameroon
-
 Canada
-
 Chile
Chile
-
 China
China
-
 Colombia
-
 Costa Rica
-
 Cote d'Ivoire
-
 Croatia
-
 Cyprus
-
 Czech Republic
-
 Denmark
-
 Dominican Republic
-
 Ecuador
-
 Egypt
Egypt
-
 Estonia
-
 Eswatini
-
 Ethiopia
-
 Finland
-
 France
-
 Georgia
-
 Germany
-
 Ghana
Ghana
-
 Greece
-
 Haiti
Haiti
-
 Hong Kong
-
 Hungary
-
 India
India
-
 Indonesia
-
 Iran, Islamic republic
-
 Iraq
Iraq
-
 Ireland
-
 Israel
-
 Italy
Italy
-
 Jamaica
-
 Japan
Japan
-
 Jordan
-
 Kazakhstan
-
 Kenya
Kenya
-
 Korea
Korea
-
 Kuwait
-
 Kyrgyzstan
-
 Laos
Laos
-
 Latvia
-
 Lebanon
-
 Libyan Arab Jamahiriya
-
 Lithuania
-
 Luxembourg
-
 Macedonia
-
 Madagascar
-
 Malaysia
-
 Malta
Malta
-
 Mauritius
-
 Mexico
-
 Moldova
-
 Mongolia
-
 Montenegro
-
 Morocco
-
 Mozambique
-
 Namibia
-
 Nepal
Nepal
-
 Netherlands
-
 Nigeria
-
 Norway
-
 Oman
Oman
-
 Pakistan
-
 Palestine
-
 Papua New Guinea
-
 Peru
Peru
-
 Philippines
-
 Poland
-
 Portugal
-
 Puerto Rico
-
 Qatar
Qatar
-
 Romania
-
 Rwanda
-
 Saudi Arabia
-
 Serbia
-
 Singapore
-
 Slovakia
-
 Slovenia
-
 Somalia
-
 South Africa
-
 Spain
Spain
-
 Sri Lanka
-
 Sweden
-
 Switzerland
-
 Syrian Arab Republic
-
 Taiwan
-
 Tajikistan
-
 Tanzania, United Republic Of
-
 Thailand
-
 Trinidad and Tobago
-
 Tunisia
-
 Turkey
-
 UAE
UAE
-
 Uganda
-
 Ukraine
-
 United Kingdom
-
United States
-
 Uzbekistan
-
 Venezuela
-
 Vietnam
-
 Yemen
Yemen
-
 Zambia
-
 Zimbabwe
- Forex
- Crypto
