Best Leading Indicators In Trading


Editorial Note: While we adhere to strict Editorial Integrity, this post may contain references to products from our partners. Here's an explanation for How We Make Money. None of the data and information on this webpage constitutes investment advice according to our Disclaimer.
Top leading indicators for beginners are:
There are leading indicators and lagging indicators. Leading indicators lead the trend and can be used to determine the oversold and overbought zones. Lagging indicators lag behind the price and are used to confirm a long-term pattern or trend. In this review, we will introduce you to the first category – leading indicators.
Best leading technical analysis indicators
The majority of oscillators are considered leading indicators. Although there are opinions that oscillators are also essentially lagging indicators, they still provide an opportunity to predict the future price behavior at least in the near future. In trading strategies, they are considered indicators that confirm the main signal, i.e. the signals that complement trend indicators. Let us introduce the best of them.
RSI (Relative Strength Index)
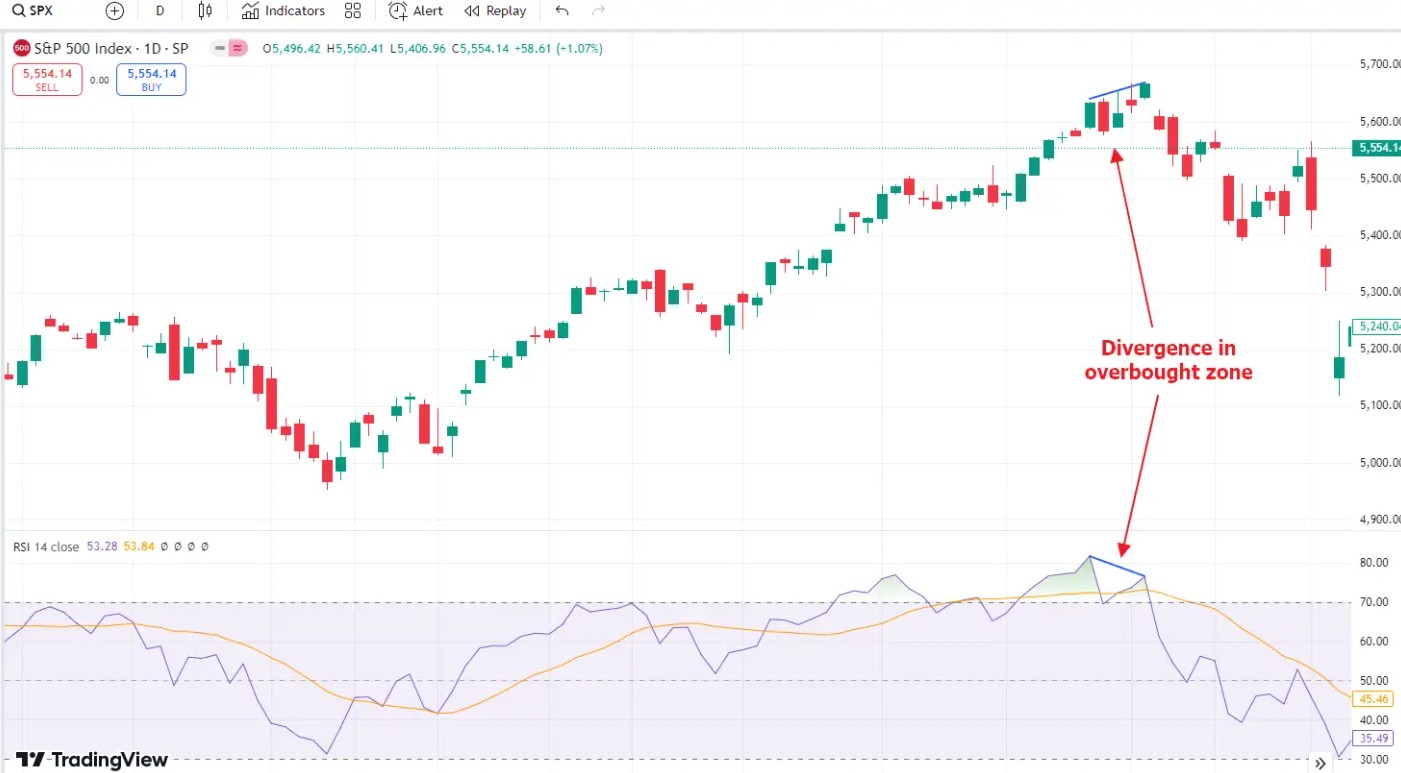
Relative Strength Index is an oscillator that measures the speed and magnitude of price changes. The close prices of the previous and current candlesticks are compared, showing the price momentum. It is located under the price chart. It is displayed on a scale of zero to 100. Zones above 70 and below 30 are the overbought and oversold zones respectively.
Things to know about the indicator:
Use cases. The indicator works well on time frames from H1 for any currency pair. It is not desirable to use RSI in a flat movement of the price.
Calculation formula. The indicator is calculated in several steps. First, the range of positive and negative price change is calculated through comparison of the Close prices of two latest candlesticks. The result is leveled by SMA, after which the indicator value is calculated.
Signals. The main signals include a reversal in the overbought or oversold zones and divergence. Reversal indicates the appearance of a new trend. Divergence means that the price will soon reverse following the indicator.
Compared to other oscillators, RSI provides confirming signals in trending markets with relatively higher accuracy.
MACD (Moving Average Convergence/Divergence)
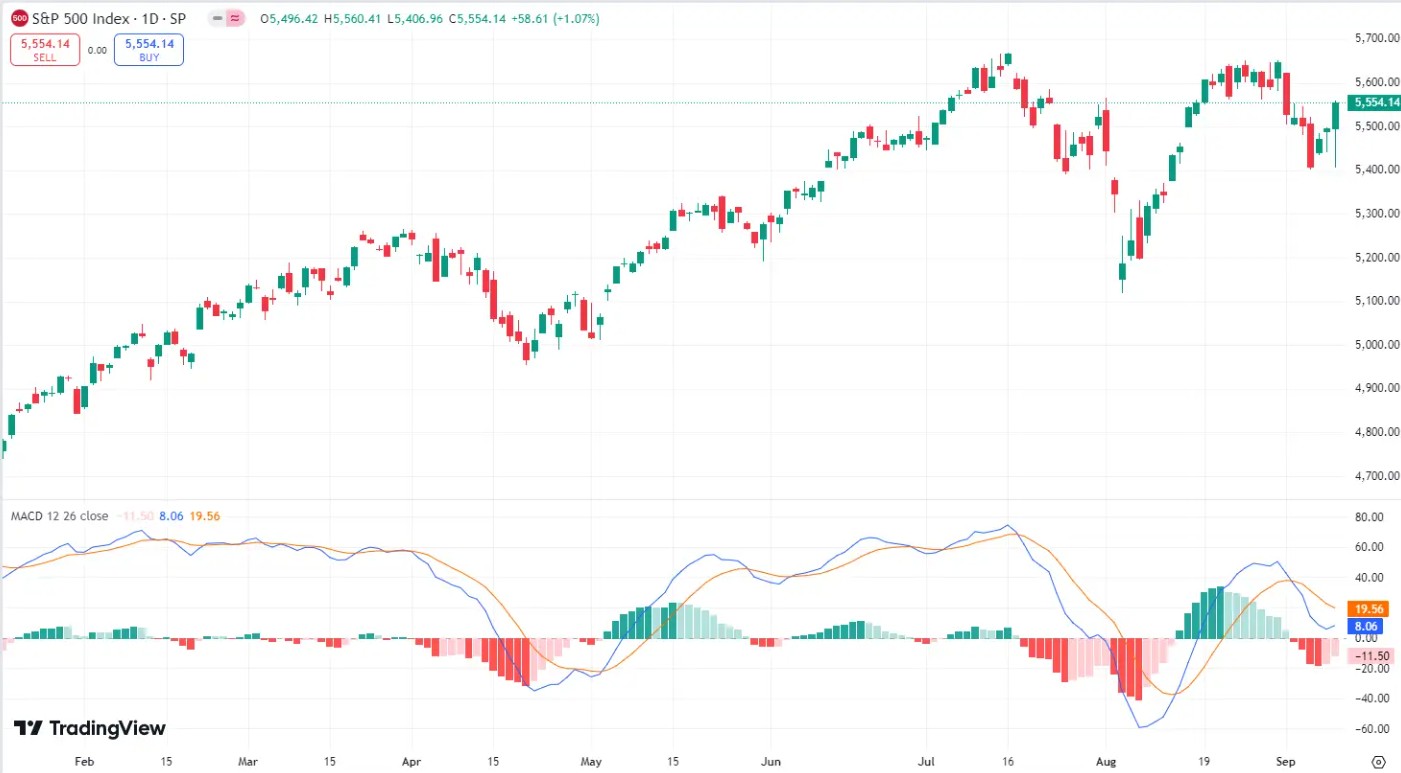
MACD is a leading momentum indicator that shows the relationship between two moving averages of an asset’s price. It is located under the price chart. It is drawn as a histogram with columns placed above and below the zero level. Also, a line is added to the indicator chart that overlaps the histogram.
Things to know about the indicator:
Use cases. MACD is most commonly used on daily and weekly charts to identify major trend changes and momentum shifts in stocks, Forex, commodities, indexes, and cryptocurrencies. It works on any timeframe but may be noisier on very short timeframes like minutes and hours.
Calculation formula. The indicator is based on the difference between exponential moving averages of different periods, which are converted into a histogram and a signal line. The signal line is a simple moving average of the MACD.
Signals. MACD crossings with its signal line, divergence, a significant change in the height of the histogram columns and the nature of the smoothness of the change. The general meaning of the signals is defining overbought and oversold zones, as well as the deviation of the current price from its average values (difference between moving averages of different periods).
MACD is one of the most frequently used oscillators in trading strategies. It is interesting in terms of the number of signals that are easily found and interpreted in the trending market. It works both in a market with a trend or in a flat.
ADX (Average Directional Index)
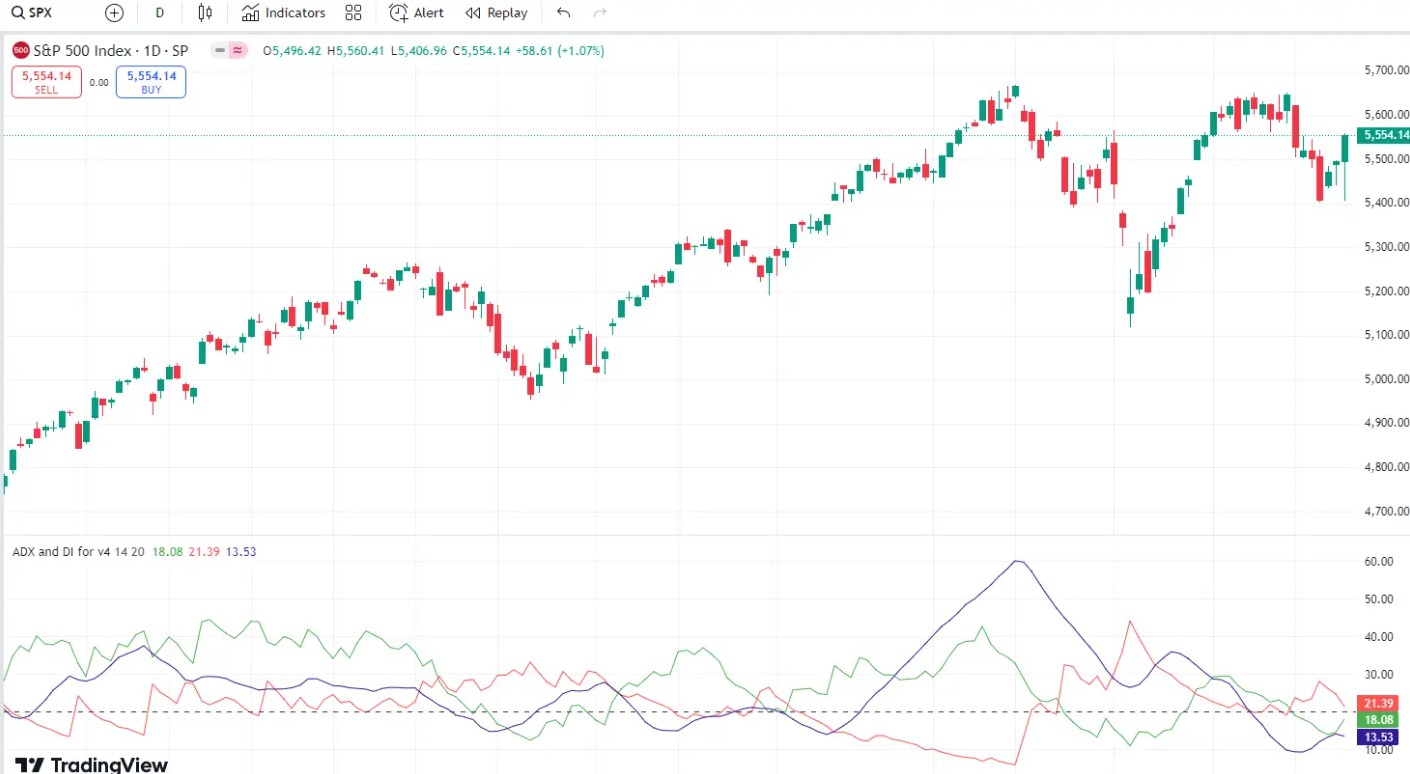
Average Directional Index is a leading indicator in the Forex market that combines the properties of a trend measuring instrument and an oscillator. It is located under the price chart and consists of three lines: the main line and two accompanying lines (+Di, -Di). Signals of the main and accompanying lines are often considered separately, but their coincidence speaks of significance.
Things to know about the indicator:
Use cases. Any currency pairs, including crosses. It is often used to determine the moment when the price exits the flat.
Calculation formula. The indicator has a step-by-step formula for calculating accompanying lines, which then form the basis for calculating the main line. The formula includes High, Low and EMA values.
Signals. The main line shows the strength of the trend regardless of its direction. If it moves up, the upward or downward movement accelerates, and the body of candlesticks grows. The range of movement of the line indicating a strong trend is 40%-60%. Crossing of accompanying lines and their location relative to each other indicates the direction of the trend.
The indicator is considered to give false signals, but if you learn to interpret the signals right, ADX can be used as the main indicator.
Momentum Indicator
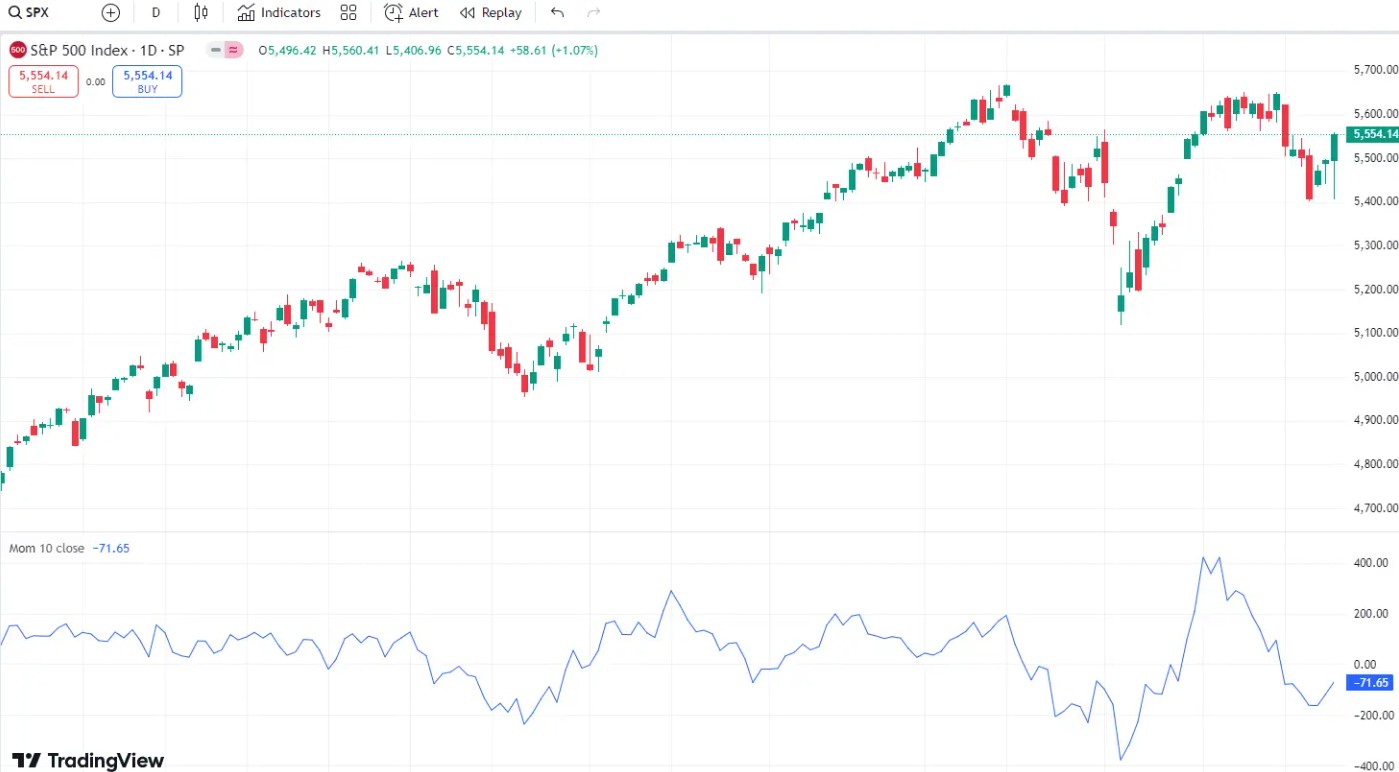
Momentum is a classic leading oscillator that shows the speed at which the price is changing over a fixed period of time. On the chart, it is displayed under the price as a line without a fixed range of movement.
Things to know about the indicator:
Use cases. As an additional confirming indicator on any markets, including stock and cryptocurrency markets. Timeframe selection depends on the results of testing.
Calculation formula. The difference between the close price of the current candlestick and the Close price x number of days ago.
Signals. Main signals: reversal at visible abnormal extremes and divergence. Since the indicator compares Close prices, it is within the range if the price moves smoothly. If the indicator moves beyond the range or reverses indicates an overbought/oversold signal with trend reversal. Crossing of the median level by the indicator indicates an additional confirming signal.
The advantage of the indicator is the clear logic of how it works. The main task is selection of settings parameters, which largely depends on the asset volatility. The longer the period of increased volatility, the more displaced extreme the indicator will draw.
ATR (Average True Range)
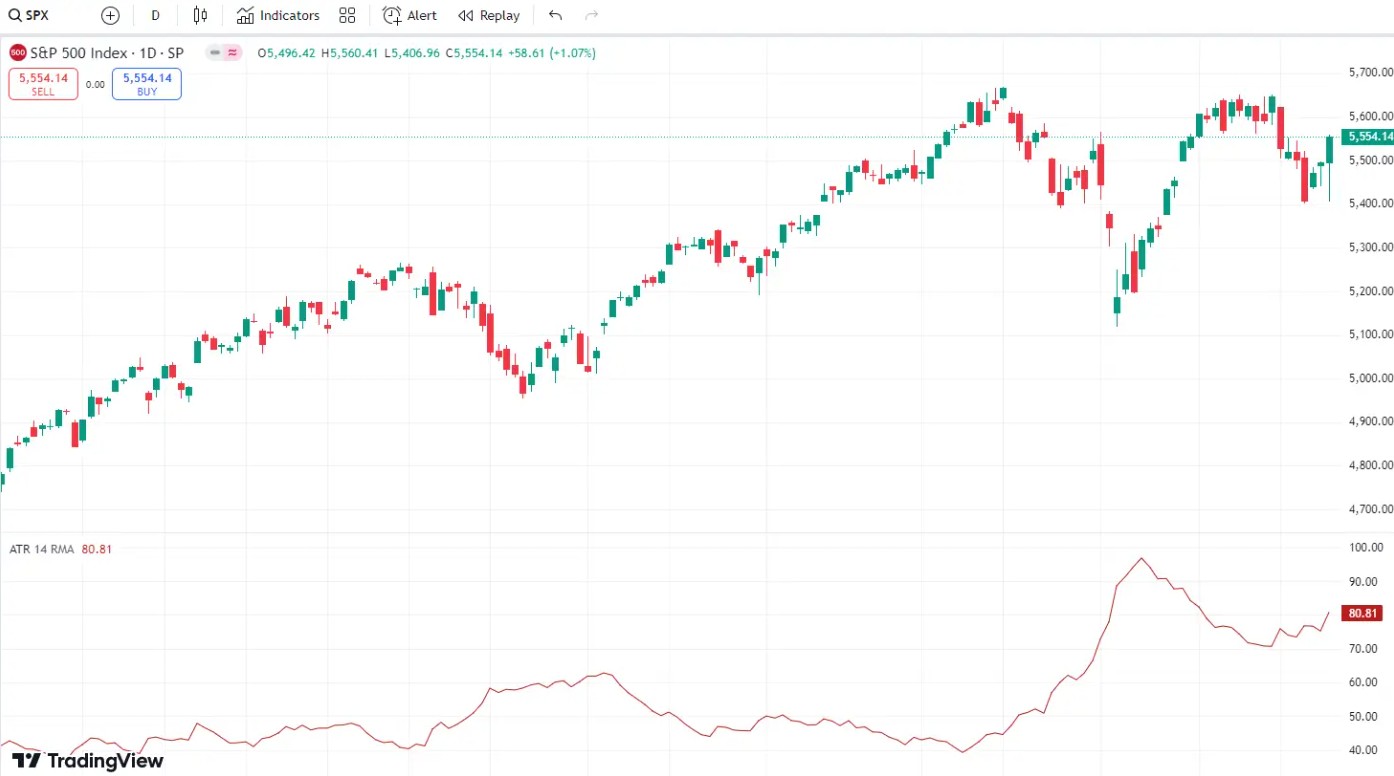
ATR is a trend oscillator that is considered a leading indicator. It is used to measure market volatility (average true range of prices). It is located under the price charge as a line without the fixed range of movement.
Things to know about the indicator:
Use cases. It is used on any market and timeframe. It is excellent for preliminary analysis on timeframes from H1.
Calculation formula. Three formulas are used to calculate the indicator: the difference between extremes of the current candlestick, the modules of the differences between the current High price and the previous Close, the current Low price and the previous Close. The maximum value of the three leveled by MA is taken into account.
Signals. Main signal: growth or decline of the indicator values relative to the previous values. ART growth when the price passes up to 30% of its range is a signal to open a position. To determine the visual range of the average volatility, the scale of the chart is reduced. The indicator does not indicate the points of a possible position opening.
ATR is often used as an additional indicator in the “several screens” strategies. For example, if the daily timeframe shows average volatility confirmed by a calculator, the distance the price has already traveled inside the day at the time when the signal appeared is measured. That’s how take profit targets, possible pivot points and stop levels are determined.
CCI (Commodity Channel Index)
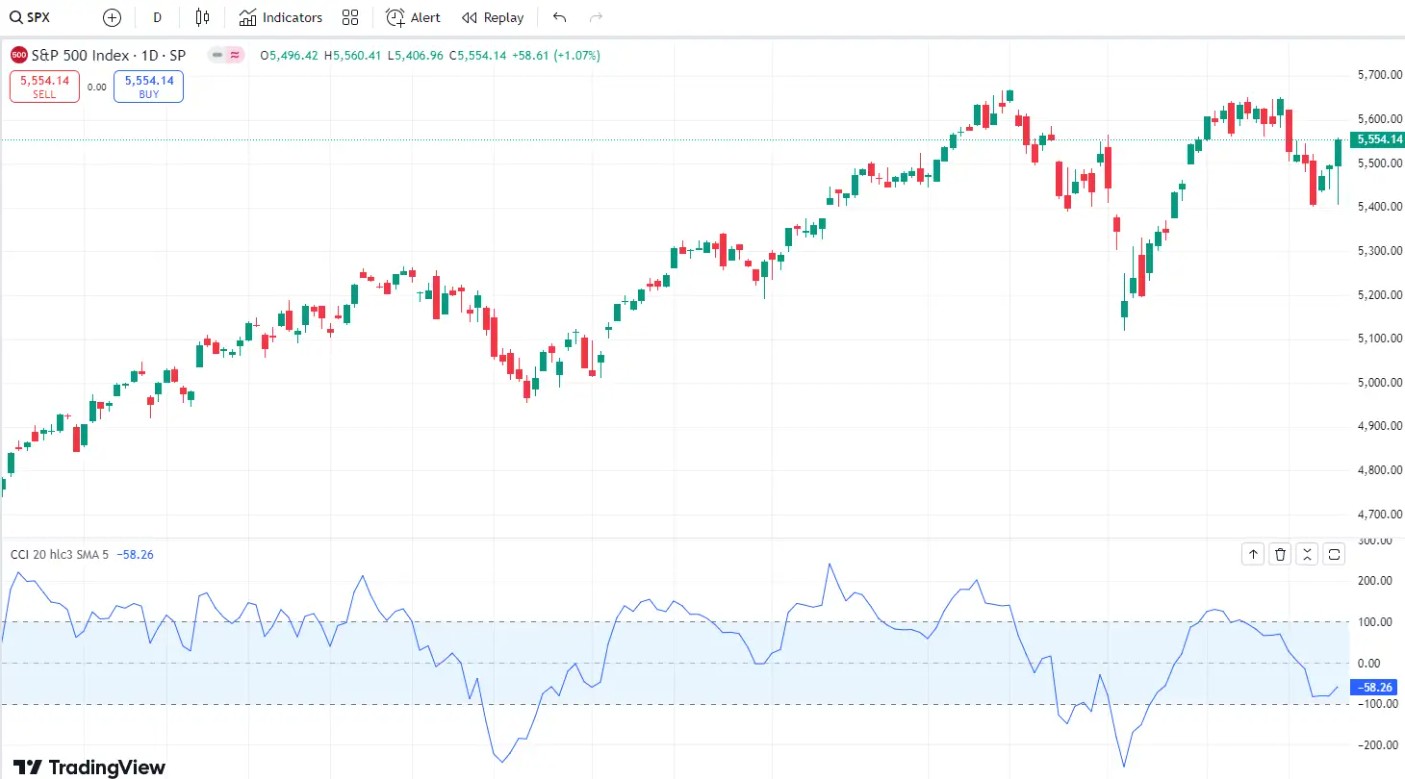
Commodity Channel Index is a leading oscillator used to determine the overbought and oversold zones. It can be used to determine the areas of a trend fading with a subsequent reversal. The indicator is a line under the price charge. The indicator has a range from -100 to +100. Going beyond these zones indicates that an asset is overbought or oversold.
Things to know about the indicator:
Use cases. The indicator can be applied to any asset. It is advisable to set a timeframe from M30 to avoid the influence of price noise. The period is usually set by the number of working days. For example, for medium-term strategies on a daily interval, it is a period of 10, equal to 2 weeks. For intraday strategies on an hourly interval – 24.
Calculation formula. There are several steps for calculation of this indicator. First, the Typical Price is calculated by the formula of the arithmetic mean of Max, Min, Close prices. Then the moving average is calculated. The final value of CCI is calculated as the difference between the Typical Price and the moving average to the average deviation multiplied by a constant.
Signals. Main signal: indicator reaching an overbought/oversold zone. In swing trading, crossing of the median zero level by CCI can be used as a confirming signal. This may mean that a prolonged correction is turning into a new trend.
CCI is one of the most convenient indicators thanks to the clearly drawn edge levels of the range. It is often used together with RSI.
OnChart Stochastic
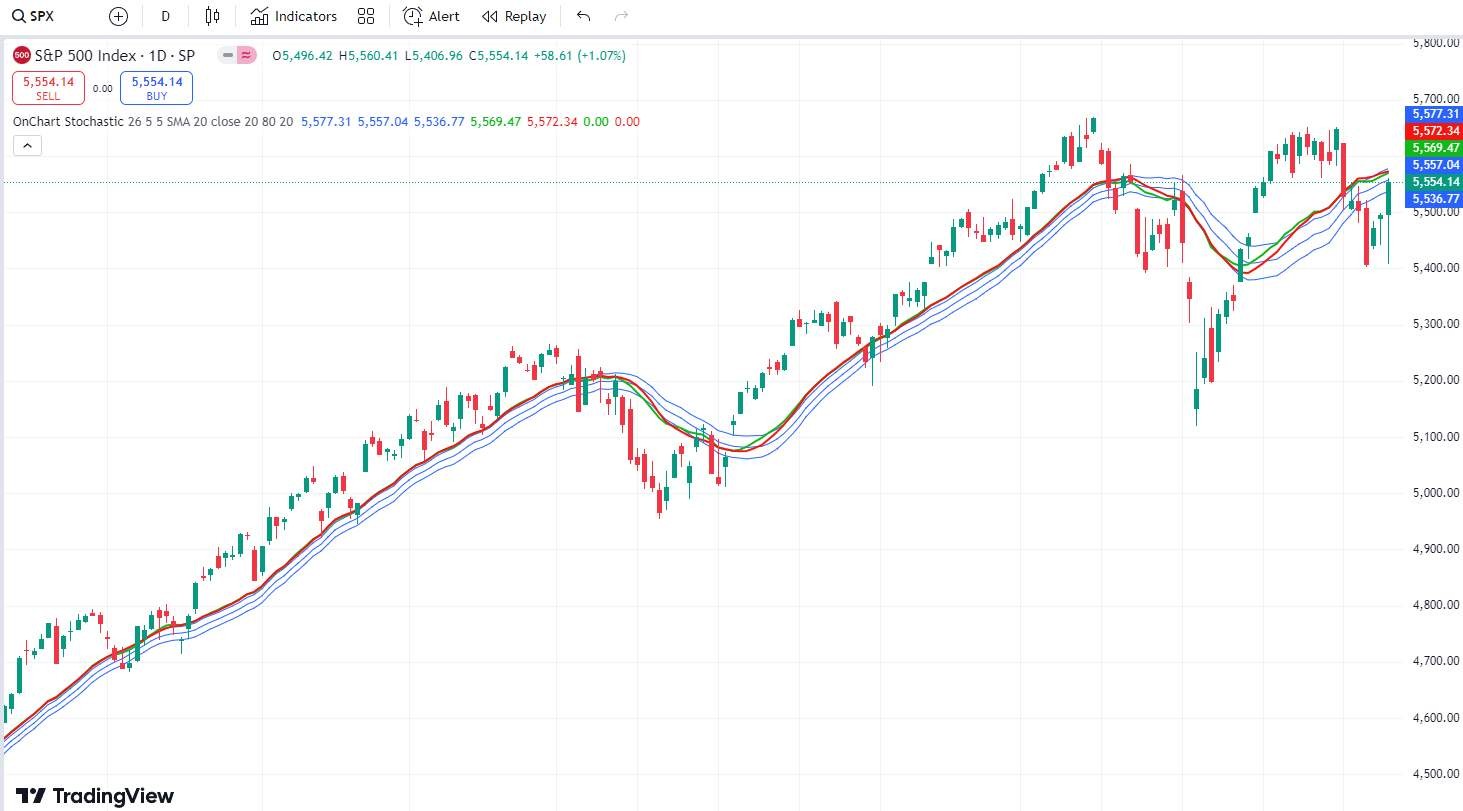
This is a modified version of the classic Stochastic Oscillator that works by the same principle, but is drawn differently. OnChart Stochastic is drawn directly on the price chart. It forms a channel that acts as support and resistance levels. Also, two lines are plotted on the chart – the main one (moving average) and the signal (stochastic curve).
Things to know about the indicator:
Use cases. The indicator can be used for currency pairs. It is used for intraday strategies as a trend confirming signal. It can be the main signal for channel trading strategies.
Calculation formula. Calculation formula of stochastic lines is the same as the formula for the Stochastic Oscillator.
Signals. The middle line of the channel determines the type of the trend. If the price is higher than this line, it is an upward trend, lower – downward trend. Signals of the main and signal lines are interpreted in the same way as the signals of the classic stochastic indicator.
OnChart Stochastic is convenient from the visual standpoint, as it is drawn on the price chart. Its second advantage is building a flexible channel. The indicator is not only a leading oscillator, but also a channel instrument.
What is a leading indicator?
Leading indicators in trading are instruments of technical analysis that measure the degree of price change relative to previous values, allow you to assess the strength of a trend, and help you see areas of possible price trend reversals.
They are used for:
Confirming trend movement;
Evaluating the strength of a trend;
Searching for potential zones, levels of reversal.
Leading indicators provide information about a trend. They can be used to assess the probability of continuation of a strong trend movement, or, conversely, to see an upcoming recession, transition into a flat or breakout from a sideways movement.
These are used mostly in short-term and intraday strategies. On long-term timeframes, they give more false signals due to redrawing, due to the drawing formula they turn from leading to lagging ones. Maybe, you are also interested in information about why technical analysis indicators are redrawn.
Types of leading indicators
Leading indicators can be categorized based on their function. Below are the primary types with examples and applications:
Momentum indicators. Measure the speed of price movements to identify potential reversals. Examples include the RSI and Stochastic Oscillator.
Volume indicators. Analyze trading volume to assess the strength of a price move. A commonly used volume indicator is the On-Balance Volume (OBV).
Volatility indicators. Evaluate the rate of price fluctuations to predict market activity. Bollinger Bands are a popular choice for assessing volatility.
Pros and cons of leading indicators
Leading indicators are often used in Forex to set goals and manage risks. When an indicator breaks out of the overbought zone, a take-profit order is set in the opposite zone. The stop loss is pulled up to the breakeven level on the edge of the overbought zone.
- Pros
- Cons
Gives you a heads-up. Leading indicators can provide early signals about price changes, giving you a leg up on the market. This early information helps you act before the crowd.
Spotting trends early. By reading leading indicators, you can catch trends right at the start, avoiding the chase after they’re already established and giving you a potential edge.
Fits your trading style. Leading indicators are versatile and can be applied to various asset types like stocks, Forex, or commodities. Whether you’re into short-term or long-term trading, these indicators can fit your approach.
Helps with managing risk. Predicting potential market moves before they happen helps you plan better, minimizing the risk of being caught off-guard during market reversals.
Can mislead you. Leading indicators aren’t foolproof—they can give false signals, leading to early or wrong decisions. The data they use may not always accurately reflect what will happen next.
Reading them the right way. Understanding how to interpret leading indicators properly takes time. A beginner might get confused and make decisions that don’t align with actual market conditions.
Waiting for confirmation. Though they can predict future moves, leading indicators may not confirm the trend immediately. There can be a waiting period before the forecasted movement takes place.
Don’t lean too much on it. Relying solely on leading indicators can lead to a narrow view of the market. It’s important to use them in conjunction with other tools to get a broader, more balanced perspective.
The drawbacks of leading indicators are mitigated by additional filters, for example, additional indicators, a search for a strong movement on longer timeframes.
What are the best trading platforms for trading with indicators?
TradingView provides access to most of the indicators discussed above. Below, we have looked at different brokers that work with this platform, letting you trade directly and making the process smoother and quicker.
| Demo | Min. deposit, $ | TradingView | MT4 | MT5 | Min Spread EUR/USD, pips | Max Spread EUR/USD, pips | Regulation level | Open an account | |
|---|---|---|---|---|---|---|---|---|---|
| Yes | 50 | Yes | No | Yes | 0.9 | No | Tier-1 | Go to broker Your capital is at risk. |
|
| Yes | 100 | Yes | No | No | 0.5 | 0.9 | Tier-1 | Go to broker 80% of retail CFD accounts lose money. |
|
| Yes | No | Yes | Yes | Yes | 0.1 | 0.5 | Tier-1 | Go to broker Your capital is at risk. |
|
| Yes | 100 | Yes | Yes | Yes | 0.7 | 1.2 | Tier-1 | Study review | |
| Yes | 1 | Yes | Yes | No | 0.6 | 1.2 | Tier-1 | Study review |
Combining leading indicators with other analysis tools
While leading indicators provide valuable insights, their effectiveness is enhanced when used in conjunction with other analysis methods. Here are ways to improve trading accuracy by combining leading indicators with complementary tools:
Combine with volume patterns. Leading indicators give you a glimpse of price direction, but when you combine them with volume patterns, you get a much clearer picture. If the indicator points to a trend reversal but the volume is low, the signal might not be strong enough to act on. This prevents you from making trades based on weak signals.
Check with moving averages. When your leading indicator hints at a trend change, use moving averages to confirm it. If both indicators align, your trade becomes more reliable. Moving averages help smooth out the noise in the market and give you more confidence in the potential trade.
Use alongside key levels. Pairing leading indicators with important support and resistance levels is a powerful way to predict price movement. If the indicator shows a breakout near resistance, it’s worth considering—especially when it aligns with these key levels.
Look for signs of divergence. If your leading indicator is showing a possible trend, check for divergence with oscillators. For example, if the price hits new highs but the oscillator isn’t confirming the same, it could be a sign of a reversal, warning you not to jump into the trade too soon.
How to set up leading indicators?
Setting up leading indicators in trading involves a series of steps to configure the specific indicator(s) you wish to use on your trading platform. Here's a general guide on how to set up leading indicators:
Choose the leading indicator. Scroll through the list of indicators and select the leading indicator you want to set up. Common leading indicators include the Relative Strength Index (RSI), Moving Average Convergence Divergence (MACD), Stochastic Oscillator, and more.
Adjust the settings. After selecting the indicator, you'll typically have the option to customize its settings. This includes selecting the time period (e.g., 14 for the RSI), choosing the type of moving average (e.g., exponential or simple for the MACD), and setting overbought and oversold levels (for RSI, for example).
Apply the indicator to the chart. Once you've configured the indicator settings to your liking, click the "Apply" or "OK" button. The indicator will then be overlaid onto your price chart.
Interpret the signals. Leading indicators generate signals based on their calculations. These signals might include overbought/oversold conditions, bullish or bearish crossovers, and more. Study the indicator signals to make trading decisions.
Combine with other analysis. Leading indicators are most effective when used in conjunction with other forms of analysis, such as chart patterns, support and resistance levels, and fundamental analysis. Consider the broader context before making a trading decision.
Leading vs lagging indicators – which is better?
The choice depends on your trading style and objectives. Here’s a quick comparison:
Leading Indicators
- Pros
- Cons
Pros. Provide early trend signals, confirm strength, and aid in risk management.
Cons. Prone to false signals, complex interpretation, and can lead to overtrading.
Lagging Indicators
- Pros
- Cons
Pros. Confirm trends, offer smoother signals, and are easier for beginners.
Cons. Delayed signals, limited predictive power, and risk of losses in choppy markets.
Both types are valuable when used appropriately and often work best in combination.
Combine leading indicators and time frames for better trading accuracy

When learning to use leading indicators, a lot of beginners stick to just one indicator, but mixing a few can give you a fuller picture of what’s happening in the market. For example, combining the Relative Strength Index (RSI) with the Moving Average Convergence Divergence (MACD) can provide a clearer view of market momentum and possible trend changes. The RSI helps spot overbought or oversold conditions, while the MACD shows you how strong the current trend is.
When used together, these indicators give you a more solid understanding of potential market shifts, but don’t overcomplicate things—keeping things simple can often be more effective.
Another important tip is to match your indicators to your specific trading style. For example, indicators like the Stochastic Oscillator work best for short-term trades, but may not be as useful for longer-term trades.
Make sure to tune the time frame of your indicators to fit the kind of trading you’re doing, whether it's day trading or swing trading. The wrong time frame can lead to misreading the signals and jumping into trades too early. Adjusting your indicators to fit the market conditions and your goals will give you much more reliable results.
Conclusion
In summary, mastering the top leading indicators such as Moving Average Convergence Divergence (MACD) and Relative Strength Index (RSI) is crucial for staying ahead in financial markets. These tools empower traders to anticipate shifts in momentum and potential trend reversals, providing a clear edge over those who rely solely on lagging data. For instance, using RSI to spot overbought conditions can signal timely exits, while MACD crossovers may indicate optimal entry points. Committing to a disciplined approach with leading indicators not only enhances decision-making, but also lays the groundwork for long-term trading success. Ultimately, the real power lies in consistently applying these indicators to transform insightful data into smart, profitable actions.
FAQs
What common mistakes should traders avoid when using leading indicators for trading success?
How do market conditions impact the reliability of leading indicators in trading?
Are there specific leading indicators recommended for beginner traders aiming for trading success?
What role does time frame selection play in the effectiveness of leading indicators for trading?
Editors' Top Picks and Insights

Toncoin becomes Gram: Why Durov restored token's original name

Why Tether flipping Ethereum is a pivotal moment for crypto

MiCA deadline: Why crypto companies are leaving Europe

From “Holy Trinity” to WLD crash: How Arthur Hayes became a market-moving seller

The world's first trillionaire: How Musk built his fortune on electric cars, space and AI

How precious-metals mining revival is reshaping portfolios in 2026
Related Articles
Team that worked on the article
Mikhail Vnuchkov joined Traders Union as an author in 2020. He began his professional career as a journalist-observer at a small online financial publication, where he covered global economic events and discussed their impact on the segment of financial investment, including investor income.
Chinmay Soni is a financial analyst with more than 5 years of experience in working with stocks, Forex, derivatives, and other assets. As a founder of a boutique research firm and an active researcher, he covers various industries and fields, providing insights backed by statistical data.
Mirjan Hipolito is a journalist and news editor at Traders Union. She is an expert crypto writer with five years of experience in the financial markets.
The deviation is a statistical measure of how much a set of data varies from the mean or average value. In forex trading, this measure is often calculated using standard deviation that helps traders in assessing the degree of variability or volatility in currency price movements.
Forex indicators are tools used by traders to analyze market data, often based on technical and/or fundamental factors, to make informed trading decisions.
Swing trading is a trading strategy that involves holding positions in financial assets, such as stocks or forex, for several days to weeks, aiming to profit from short- to medium-term price swings or "swings" in the market. Swing traders typically use technical and fundamental analysis to identify potential entry and exit points.
ATR (Average True Range) is a volatility indicator that helps traders assess the potential price range or volatility of a financial instrument. It calculates the average of true price ranges over a specified period, providing insight into the level of price fluctuations within that timeframe.
Fundamental analysis is a method or tool that investors use that seeks to determine the intrinsic value of a security by examining economic and financial factors. It considers macroeconomic factors such as the state of the economy and industry conditions.

-
 Afghanistan
-
 Albania
-
 Algeria
-
 Angola
-
 Argentina
-
 Armenia
-
 Australia
-
 Austria
-
 Azerbaijan
-
 Bahamas
-
 Bahrain
-
 Bangladesh
-
 Belarus
-
 Belgium
-
 Bolivia
-
 Botswana
-
 Brazil
-
 Brunei
-
 Bulgaria
-
 Cambodia
-
 Cameroon
-
 Canada
-
 Chile
Chile
-
 China
China
-
 Colombia
-
 Congo
Congo
-
 Costa Rica
-
 Cote d'Ivoire
-
 Croatia
-
 Cuba
Cuba
-
 Cyprus
-
 Czechia
-
 DR Congo
-
 Denmark
-
 Dominican Republic
-
 Ecuador
-
 Egypt
Egypt
-
 El Salvador
-
 Estonia
-
 Eswatini
-
 Ethiopia
-
 Finland
-
 France
-
 Georgia
-
 Germany
-
 Ghana
Ghana
-
 Greece
-
 Haiti
Haiti
-
 Hong Kong
-
 Hungary
-
 India
India
-
 Indonesia
-
 Iran, Islamic republic
-
 Iraq
Iraq
-
 Ireland
-
 Israel
-
 Italy
Italy
-
 Jamaica
-
 Japan
Japan
-
 Jordan
-
 Kazakhstan
-
 Kenya
Kenya
-
 Korea
Korea
-
 Kuwait
-
 Kyrgyzstan
-
 Laos
Laos
-
 Latvia
-
 Lebanon
-
 Lesotho
-
 Libya
Libya
-
 Lithuania
-
 Luxembourg
-
 Madagascar
-
 Malaysia
-
 Malta
Malta
-
 Mauritius
-
 Mexico
-
 Moldova
-
 Mongolia
-
 Montenegro
-
 Morocco
-
 Mozambique
-
 Myanmar
-
 Namibia
-
 Nepal
Nepal
-
 Netherlands
-
 New Zealand
-
 Nigeria
-
 North Macedonia
-
 Norway
-
 Oman
Oman
-
 Pakistan
-
 Palestine
-
 Panama
-
 Papua New Guinea
-
 Paraguay
-
 Peru
Peru
-
 Philippines
-
 Poland
-
 Portugal
-
 Puerto Rico
-
 Qatar
Qatar
-
 Reunion
-
 Romania
-
 Rwanda
-
 Saudi Arabia
-
 Serbia
-
 Singapore
-
 Slovakia
-
 Slovenia
-
 Somalia
-
 South Africa
-
 Spain
Spain
-
 Sri Lanka
-
 Sweden
-
 Switzerland
-
 Syria
Syria
-
 Taiwan
-
 Tajikistan
-
 Tanzania
-
 Thailand
-
 Trinidad and Tobago
-
 Tunisia
-
 Turkey
-
 UAE
UAE
-
 Uganda
-
 Ukraine
-
 United Kingdom
-
United States
-
 Uruguay
-
 Uzbekistan
-
 Venezuela
-
 Vietnam
-
 Yemen
Yemen
-
 Zambia
-
 Zimbabwe
- Forex
- Crypto
