How To Use The DeMarker Indicator To Spot Hidden Trend Weakness


Editorial Note: While we adhere to strict Editorial Integrity, this post may contain references to products from our partners. Here's an explanation for How We Make Money. None of the data and information on this webpage constitutes investment advice according to our Disclaimer.
The DeMarker indicator is a momentum tool that measures buying and selling pressure based on price highs and lows rather than just closing prices. It helps traders spot trend exhaustion, overbought or oversold zones, and early reversal signals — making it ideal for protecting trades before price action confirms a shift. When DeMarker starts to flatten or dip while price is still climbing, that is your heads-up. The market is starting to slow behind the scenes, and if you catch it early, you can protect your trade before everyone else sees the shift.
The DeMarker indicator does not jump out on the screen like some other tools, which is why a lot of traders ignore it. But it is not just a typical momentum signal. It actually measures how strong the push is in the highs and lows of price and shows you whether that pressure is building or losing steam. What makes it really useful is its ability to give hints that the move is getting tired before the candles tell you anything. In this article, we will take a detailed look into using the DeMarker indicator effectively.
Introduction to DeMarker indicator
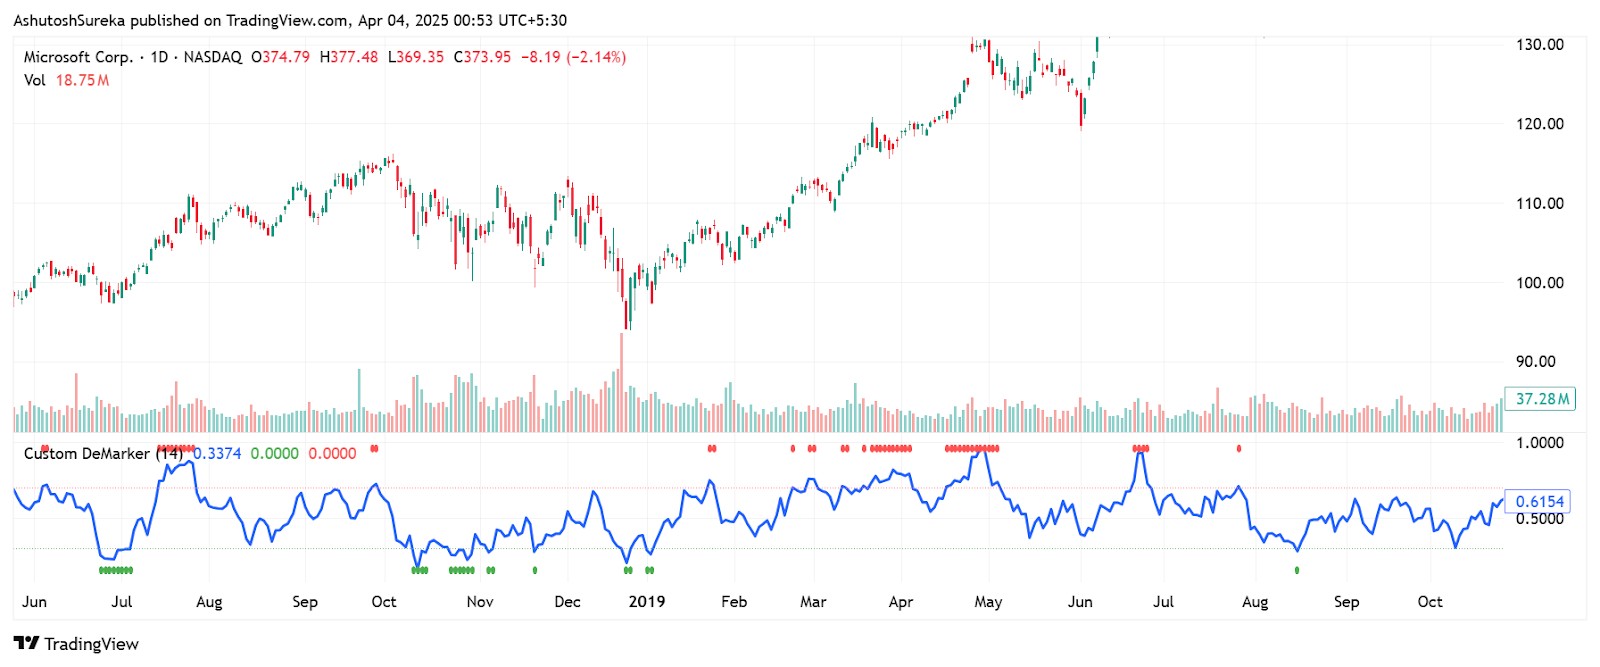
The DeMarker indicator is a momentum-based tool designed to identify potential trend reversals, overbought or oversold conditions, and short-term shifts in buying or selling pressure. Unlike some momentum indicators that only compare closing prices, the DeMarker looks at price extremes — like highs and lows — to measure how committed buyers or sellers are during a move.
What it measures
Compares the current high and low prices to those of the previous candle.
Uses that comparison to gauge demand and price exhaustion.
Outputs a line that oscillates between 0 and 1, helping identify potential tops and bottoms.
Why it’s useful
Highlights areas where price may be losing strength.
Helps avoid entering trades when a move is nearly finished.
Offers a slightly different perspective than common tools like RSI or Stochastic, which focus on closing prices.
The DeMarker is often used in strategies that combine trend-following with reversal spotting, making it a versatile tool across timeframes and markets.
Origin and development of the DeMarker indicator
The DeMarker indicator was developed by Tom DeMark, a respected figure in the world of technical analysis known for creating proprietary indicators and trading systems. His goal was to build a tool that offered earlier signals than traditional oscillators — and that could adapt well across changing market conditions.
Who created it
Tom DeMark, an analyst and trader with decades of market experience.
Known for designing practical tools focused on timing and exhaustion.
The DeMarker indicator is one of many tools in his broader trading system.
Why it was developed
Tom DeMark wanted a tool that would identify shifts in buying and selling pressure before a full reversal occurred.
He based it on the idea that extreme highs and lows reveal more about real market activity than just closing prices.
The indicator was meant to be responsive but not overly sensitive, filtering out minor fluctuations.
Understanding the DeMarker indicator formula
The DeMarker indicator is built to show you if buyers or sellers are running out of gas. It doesn’t just look at where price closed — it looks at the highs and lows from one candle to the next to figure out who’s in control.
Breaking down the calculation
First, it checks how much higher today’s high is compared to yesterday’s.
If today’s high is higher → that’s counted as buying pressure (DeMax).
If it’s not higher → it gets a value of zero.
Then it checks how much lower today’s low is compared to yesterday’s:
If today’s low is lower → that’s selling pressure (DeMin).
If it’s not lower → it gets a zero.
After that, both sets of values are averaged out — usually over 14 periods — to smooth out the data.
Finally, the DeMarker value is calculated like this.
DeMarker = Average DeMax / (Average DeMax + Average DeMin)
This gives you a number between 0 and 1.
What the number tells you
Above 0.70 → price might be too high, could reverse or slow down.
Below 0.30 → price may be too low, possibly ready to bounce.
Near 0.50 → market is neutral or undecided.
This helps traders decide when to stay out, take profit, or prepare for a shift in direction.
How to set up DeMarker indicator
The DeMarker indicator is built into most trading platforms and can be applied to any chart in just a few clicks. Once added, it appears as a line that moves between 0 and 1, helping you spot potential reversal zones and momentum shifts. Getting it set up properly can make your trading decisions more confident and less reactive.
Access the indicator
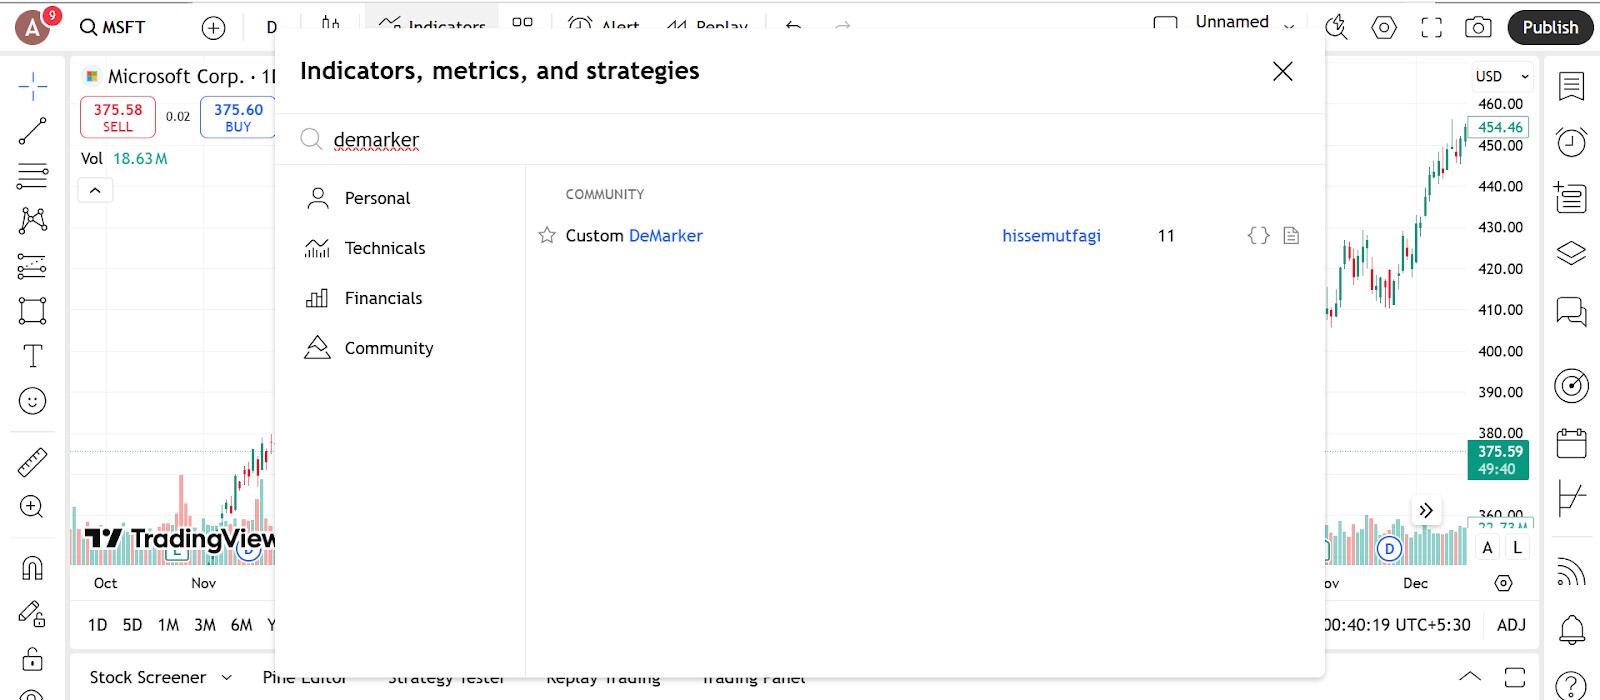
You can add the DeMarker indicator directly from your platform’s indicator list — no installation or coding required.
Where to find it
Open the indicators menu on your charting platform.
Type DeMarker in the search bar.
Select it from the list to apply it to your chart — it will load in a separate pane below the price chart.
Supported platforms
TradingView, MetaTrader 4 and 5, ThinkorSwim, and many others support the DeMarker indicator by default.
No additional add-ons or plug-ins are needed.
Setup tips
Make sure to view it on clean, uncluttered charts so the signal is clear.
Use with candlestick or line charts for better alignment of highs and lows.
Configure the parameters
Once the indicator is applied, you can fine-tune it based on your trading strategy and timeframe.
Default settings
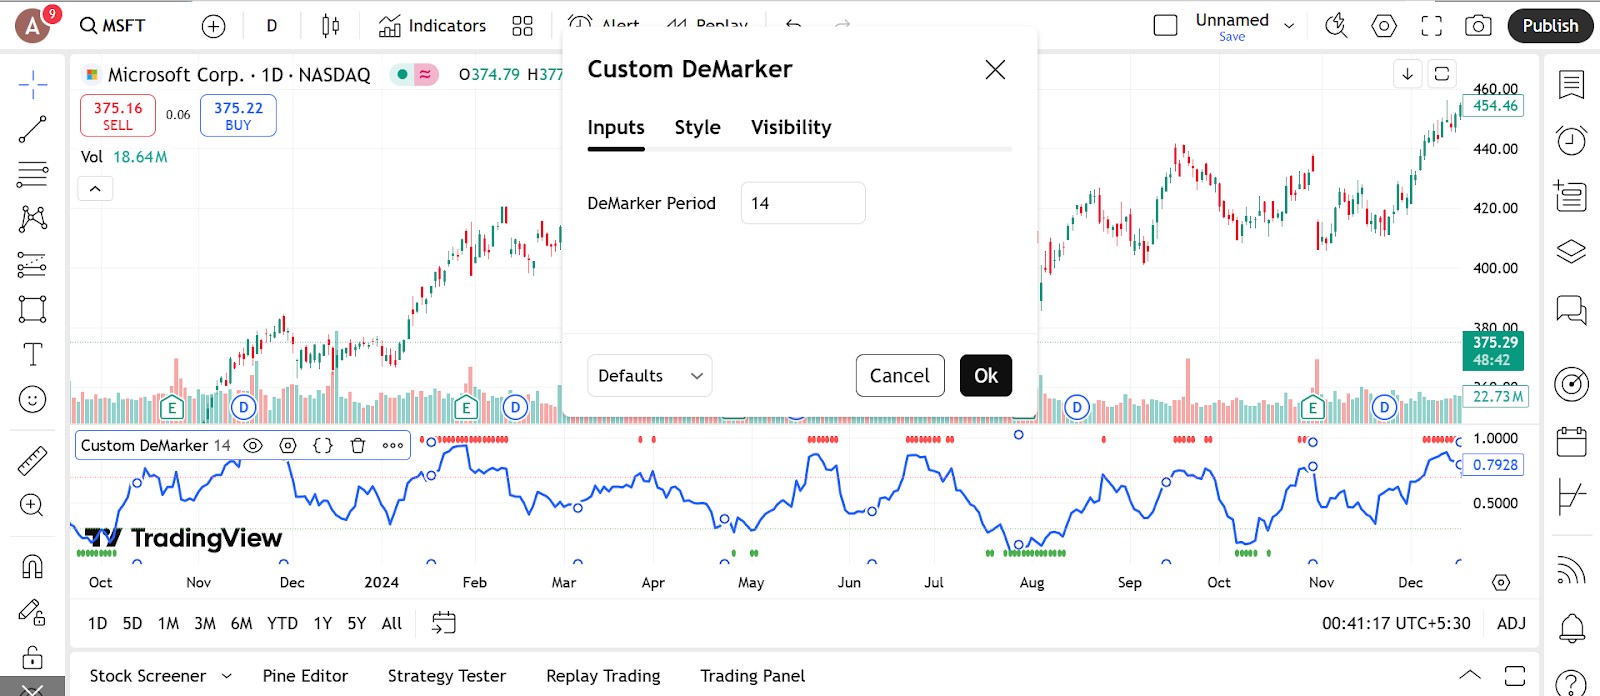
Most platforms set the period to 14, which works well for many setups.
This setting smooths out the highs and lows over 14 candles to calculate DeMax and DeMin.
The result is a balanced view of buying and selling pressure.
Custom adjustments
For faster signals, try a shorter period like 7 or 10 — more sensitive but may give more false signals.
For smoother and more stable signals, increase the period to 20 or more.
Adjust the overbought and oversold threshold lines (typically set at 0.70 and 0.30) if you prefer different levels for entry alerts.
Visual customization
Change the color of the DeMarker line to something that stands out from your chart background.
Increase the line thickness for better visibility.
Enable alerts (if your platform allows it) when the line crosses your chosen levels.
Trading strategies using DeMarker indicator
The DeMarker indicator helps traders spot price exhaustion and possible reversals. Since it’s based on highs and lows, it gives you a sense of whether buying or selling momentum is fading. Traders use DeMarker on its own or combine it with trend or price action setups to improve timing and filter false signals.
Overbought and oversold reversal strategy
This is the most common way to use DeMarker — identifying when price has moved too far, too fast, and may be ready to turn.
How it works
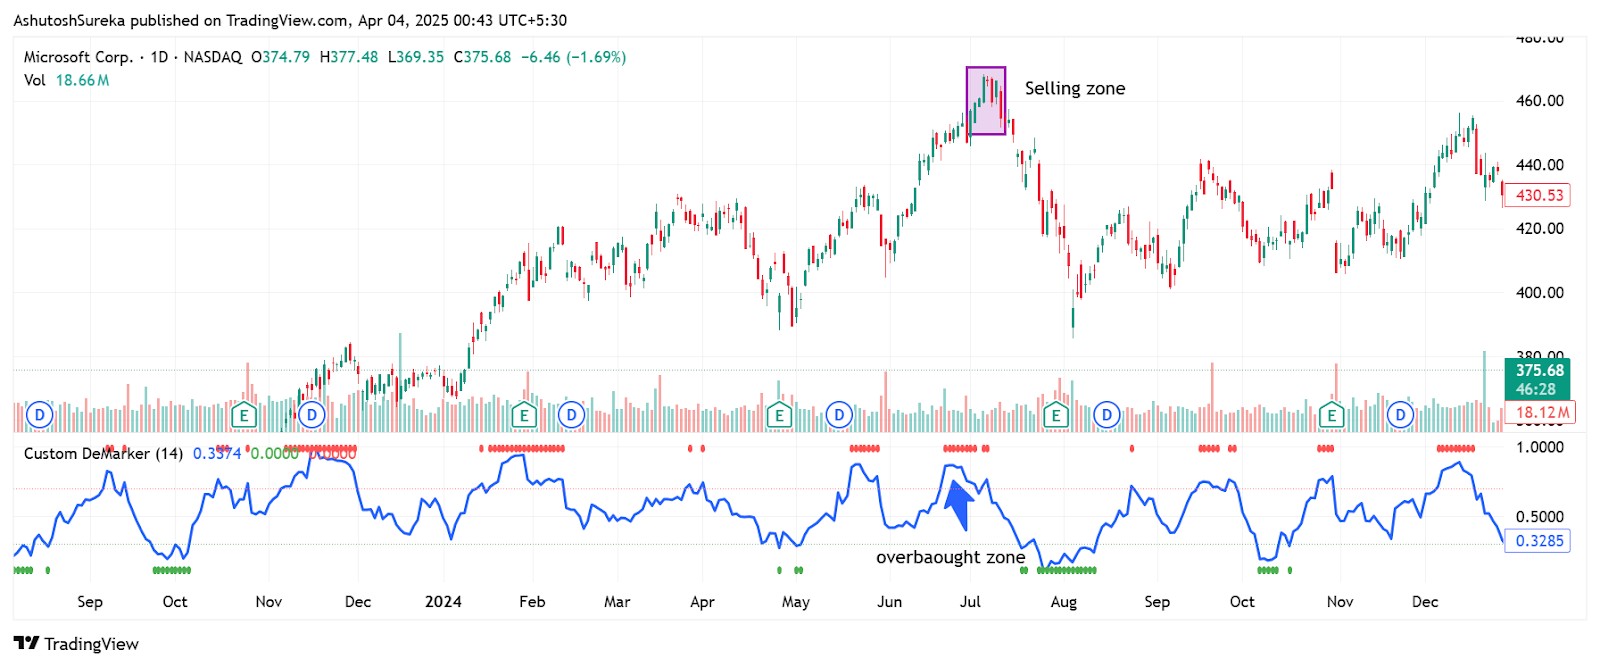
When the DeMarker line crosses above 0.70, the market is likely overbought.
When the line dips below 0.30, the market is likely oversold.
Look for confirmation from price action, like reversal candlesticks or trendline breaks.
Entry and exit tips
Sell or take profit when DeMarker crosses above 0.70 and price stalls.
Buy or prepare for a bounce when it crosses below 0.30 and price finds support.
Exit once the line returns toward 0.50 or momentum fades.
Trend continuation pullback strategy
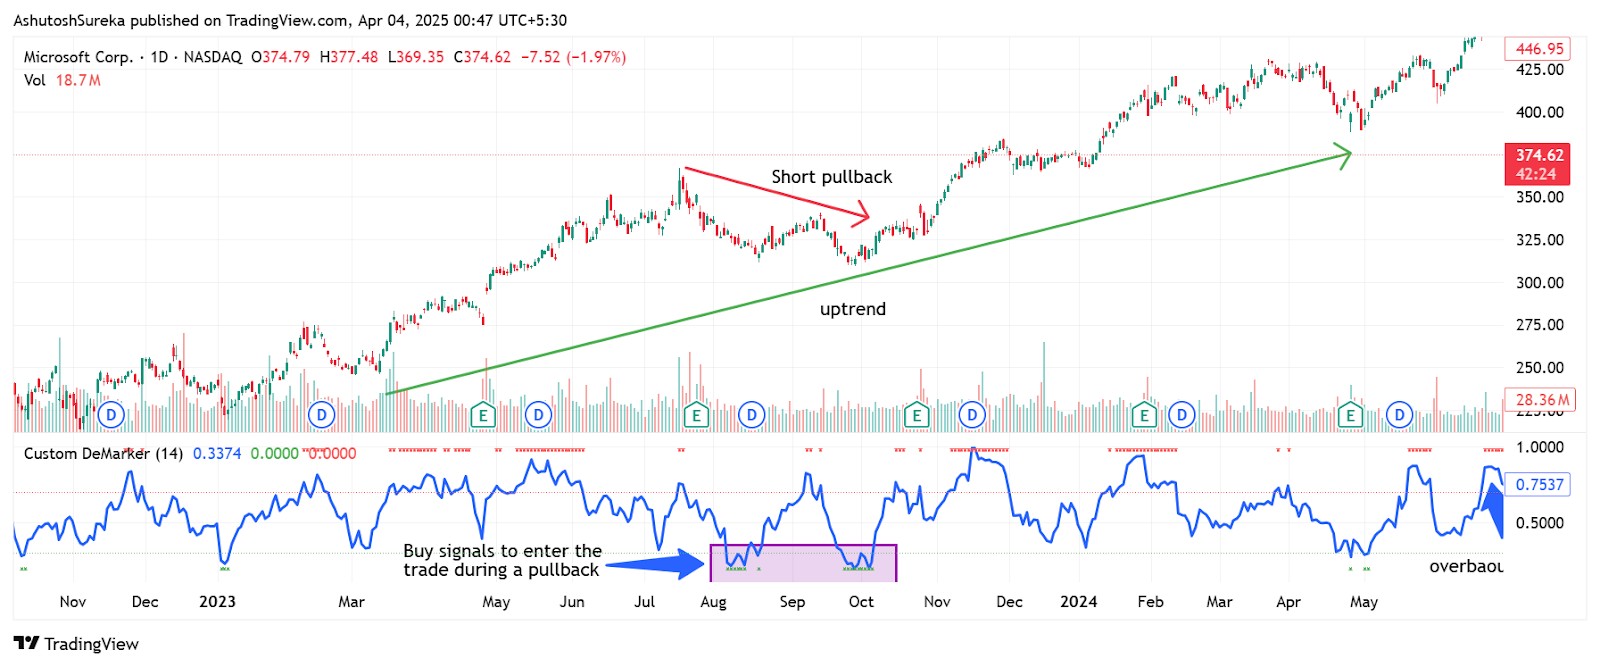
DeMarker isn’t only for reversals — it can also help you enter a trend after a short pullback.
How it works
In an uptrend, wait for DeMarker to dip near 0.30–0.40 while price pulls back.
In a downtrend, wait for DeMarker to rise toward 0.60–0.70 during a rally.
Enter when price resumes in the direction of the main trend.
Why it works
These dips often signal temporary exhaustion during a bigger move.
DeMarker helps avoid jumping in at the top or bottom.
Divergence spotting strategy
Like RSI, DeMarker can be used to spot bullish or bearish divergence, signaling a potential trend reversal before price shows it.
What to look for
Bullish divergence. Price makes a lower low, but DeMarker makes a higher low.
Bearish divergence. Price makes a higher high, but DeMarker makes a lower high.
These setups often appear before sharp reversals.
How to trade it
Wait for a confirming candle pattern or trendline break after divergence appears.
Enter with a tight stop and clear risk level.
Exit at previous support or resistance.
If your trading strategy requires the use of many technical indicators, using a broker that supports TradingView, MT5, or cTrader can make your life easier. These tools provide access to a wide range of technical tools, covering almost all the strategies you can think of. In the table below, we have presented the top brokers with access to the abovementioned platforms. You can compare them and choose the best one for yourself:
| Currency pairs | Crypto | Stocks | Min. deposit, $ | Max. leverage | TradingView | MT5 | cTrader | Regulation | TU overall score | Open an account | |
|---|---|---|---|---|---|---|---|---|---|---|---|
| 60 | Yes | Yes | 100 | 1:300 | Yes | No | No | FCA, CySEC, MAS, ASIC, FMA, FSA (Seychelles) | 6.83 | Open an account Your capital is at risk. |
|
| 90 | Yes | Yes | No | 1:500 | Yes | Yes | Yes | ASIC, FCA, DFSA, BaFin, CMA, SCB, CySec | 7.17 | Open an account Your capital is at risk.
|
|
| 68 | Yes | Yes | No | 1:200 | Yes | Yes | No | FSC (BVI), ASIC, IIROC, FCA, CFTC, NFA | 6.79 | Open an account Your capital is at risk. |
|
| 80 | Yes | Yes | 100 | 1:50 | Yes | Yes | No | CIMA, FCA, FSA (Japan), NFA, IIROC, ASIC, CFTC | 6.95 | Study review | |
| 100 | Yes | Yes | No | 1:30 | Yes | No | No | SEC, FINRA, SIPC, FCA, NSE, BSE, SEBI, SEHK, HKFE, IIROC, ASIC, CFTC, NFA | 6.9 | Open an account Your capital is at risk. |
Why trust us
We at Traders Union have analyzed financial markets for over 14 years, evaluating brokers based on 250+ transparent criteria, including security, regulation, and trading conditions. Our expert team of over 50 professionals regularly updates a Watch List of 500+ brokers to provide users with data-driven insights. While our research is based on objective data, we encourage users to perform independent due diligence and consult official regulatory sources before making any financial decisions.
Learn more about our methodology and editorial policies.
Advantages of DeMarker indicator
It spots reversals early by focusing on highs and lows. Unlike many momentum indicators that rely on closing prices, the DeMarker uses intraday highs and lows. This gives it a slight edge in picking up turning points before they’re obvious, making it great for traders who want to catch early signs of trend shifts.
Its overbought and oversold zones are simple and clear. The DeMarker moves between 0 and 1, with key levels at 0.70 and 0.30. These zones offer easy visual cues for spotting potential entry and exit points, especially when paired with price action.
It works well across trends, ranges, and timeframes. Whether you’re trading crypto pullbacks, Forex ranges, or stock reversals, the DeMarker adapts smoothly. It’s steady enough for longer setups but still responsive for intraday trades.
It gives smoother, less noisy signals. Compared to reactive tools like Stochastic, the DeMarker filters out minor fluctuations and avoids whipsaws. It’s ideal for traders who prefer calm, consistent momentum signals without constant false alarms.
Limitations of DeMarker indicator
It can signal too early or too often. Since the DeMarker is designed to lead price, it may flag a reversal while the trend is still strong. Not every dip below 0.30 or spike above 0.70 leads to a real turning point, which can tempt you into jumping in too soon without solid confirmation.
It lags during fast-moving markets. While the indicator is smooth and avoids noise, that same trait makes it slower to react during sudden breakouts or sharp reversals. If you're only relying on DeMarker, you might miss quick opportunities or get caught chasing too late.
It doesn’t show direction on its own. DeMarker reflects momentum strength but doesn’t tell you if the market is trending up or down. To get the full picture, you’ll need to pair it with tools like moving averages, trendlines, or support/resistance levels.
Settings aren’t one-size-fits-all. The standard 14-period works in many cases, but not all. Shorter settings react faster but can get noisy, while longer ones may smooth too much. You’ll need to tweak and test to match your trading style and the asset you’re working with.
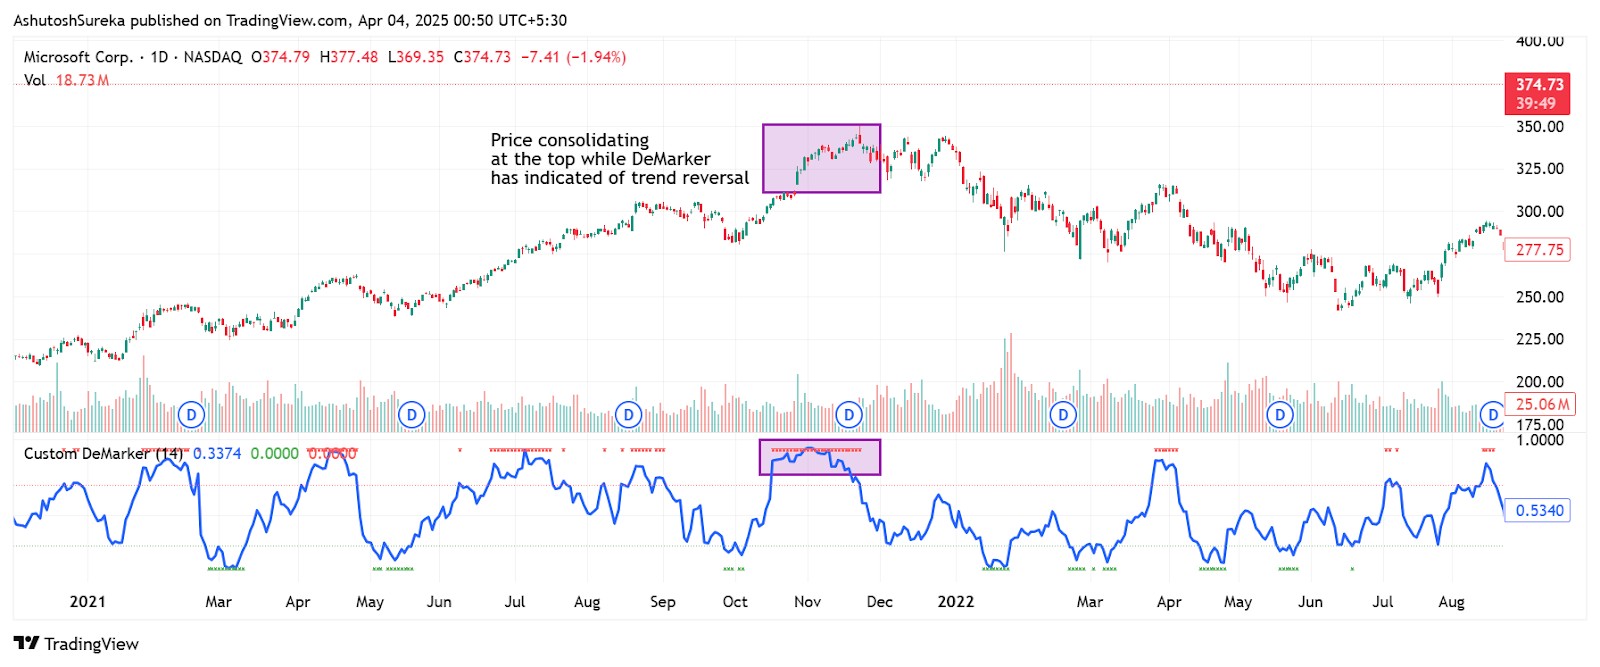
Watch DeMarker behavior, not levels, to spot hidden momentum.

One of the smartest ways to use the DeMarker indicator is to stop waiting for it to cross a level. That is where most beginners go wrong. Instead, watch how it moves. If DeMarker pushes up fast and then starts to flatten while price keeps rising, that mismatch says a lot. It means momentum is softening even though the chart still looks strong. That is your cue to act while the move is still alive. You do not need a perfect reversal. You just need to act when things feel off before the market turns on you.
Here is another move that gets overlooked. Instead of only using DeMarker to call tops or bottoms, watch how it behaves when price dips during a trend. If price pulls back but DeMarker barely drops and then turns up fast, that means buyers are still stepping in. It is a quiet signal that the dip might not last long. This kind of setup shows up more on higher time frames where strong trends are more stable. You are not trying to catch extremes. You are just watching how traders are responding and letting DeMarker show you if the pressure is still building or if it is starting to fade.
Conclusion
The DeMarker indicator is not flashy but it is sharp. If you stop focusing on big signals and start noticing the smaller shifts, you will catch signs that the push is slowing before price shows it. The strength behind a move is not always obvious on the chart. DeMarker helps you read what price is quietly telling you. It is not built to predict the next move. It is built to show you when the one in front of you is running out of steam. And that is where the real edge lives.
FAQs
How is the DeMarker indicator different from RSI?
The DeMarker indicator focuses on intra-period highs and lows to measure buying and selling pressure, while RSI compares average gains and losses. DeMarker is considered more sensitive to trend exhaustion and early reversals.
What is the DeMARK 9 rule?
The DeMark 9 rule is part of the TD Sequential indicator, where a setup of 9 consecutive bars closes higher (or lower) than 4 bars earlier. This signals a potential pause or reversal in the current trend.
What is the DeMark 13 indicator?
The DeMark 13 is the countdown phase of the TD Sequential system that follows a completed 9-setup. It looks for 13 more bars that meet specific conditions to confirm trend exhaustion and a potential reversal.
Is the DeMarker oscillator and DeMarker indicator the same?
No, the DeMarker oscillator and DeMark indicators are different. The DeMarker oscillator measures market conditions like RSI, while DeMark indicators like TD Sequential are part of a separate system used for timing trend reversals.
Related Articles
Team that worked on the article
Andrey Mastykin is an experienced author, editor, and content strategist who has been with Traders Union since 2020. As an editor, he is meticulous about fact-checking and ensuring the accuracy of all information published on the Traders Union platform. Andrey focuses on educating readers about the potential rewards and risks involved in trading financial markets.
He firmly believes that passive investing is a more suitable strategy for most individuals. Andrey's conservative approach and focus on risk management resonate with many readers, making him a trusted source of financial information.
Also, Andrey is a member of the National Union of Journalists of Ukraine (membership card No. 4574, international certificate UKR4492).
Chinmay Soni is a financial analyst with more than 5 years of experience in working with stocks, Forex, derivatives, and other assets. As a founder of a boutique research firm and an active researcher, he covers various industries and fields, providing insights backed by statistical data. He is also an educator in the field of finance and technology.
As an author for Traders Union, he contributes his deep analytical insights on various topics, taking into account various aspects.
Mirjan Hipolito is a journalist and news editor at Traders Union. She is an expert crypto writer with five years of experience in the financial markets. Her specialties are daily market news, price predictions, and Initial Coin Offerings (ICO).
Risk management is a risk management model that involves controlling potential losses while maximizing profits. The main risk management tools are stop loss, take profit, calculation of position volume taking into account leverage and pip value.
Forex trading, short for foreign exchange trading, is the practice of buying and selling currencies in the global foreign exchange market with the aim of profiting from fluctuations in exchange rates. Traders speculate on whether one currency will rise or fall in value relative to another currency and make trading decisions accordingly. However, beware that trading carries risks, and you can lose your whole capital.
Cryptocurrency is a type of digital or virtual currency that relies on cryptography for security. Unlike traditional currencies issued by governments (fiat currencies), cryptocurrencies operate on decentralized networks, typically based on blockchain technology.
A trading system is a set of rules and algorithms that a trader uses to make trading decisions. It can be based on fundamental analysis, technical analysis, or a combination of both.
Forex leverage is a tool enabling traders to control larger positions with a relatively small amount of capital, amplifying potential profits and losses based on the chosen leverage ratio.


-
 Afghanistan
-
 Albania
-
 Algeria
-
 Argentina
-
 Armenia
-
 Australia
-
 Austria
-
 Azerbaijan
-
 Bahamas
-
 Bahrain
-
 Bangladesh
-
 Belgium
-
 Botswana
-
 Brazil
-
 Brunei
-
 Bulgaria
-
 Burma
Burma
-
 Cambodia
-
 Cameroon
-
 Canada
-
 Chile
Chile
-
 China
China
-
 Colombia
-
 Costa Rica
-
 Cote d'Ivoire
-
 Croatia
-
 Cyprus
-
 Czech Republic
-
 Denmark
-
 Dominican Republic
-
 Ecuador
-
 Egypt
Egypt
-
 Estonia
-
 Eswatini
-
 Ethiopia
-
 Finland
-
 France
-
 Georgia
-
 Germany
-
 Ghana
Ghana
-
 Greece
-
 Haiti
Haiti
-
 Hong Kong
-
 Hungary
-
 India
India
-
 Indonesia
-
 Iran, Islamic republic
-
 Iraq
Iraq
-
 Ireland
-
 Israel
-
 Italy
Italy
-
 Jamaica
-
 Japan
Japan
-
 Jordan
-
 Kazakhstan
-
 Kenya
Kenya
-
 Korea
Korea
-
 Kuwait
-
 Kyrgyzstan
-
 Laos
Laos
-
 Latvia
-
 Lebanon
-
 Libyan Arab Jamahiriya
-
 Lithuania
-
 Luxembourg
-
 Macedonia
-
 Madagascar
-
 Malaysia
-
 Malta
Malta
-
 Mauritius
-
 Mexico
-
 Moldova
-
 Mongolia
-
 Montenegro
-
 Morocco
-
 Mozambique
-
 Namibia
-
 Nepal
Nepal
-
 Netherlands
-
 Nigeria
-
 Norway
-
 Oman
Oman
-
 Pakistan
-
 Palestine
-
 Papua New Guinea
-
 Peru
Peru
-
 Philippines
-
 Poland
-
 Portugal
-
 Puerto Rico
-
 Qatar
Qatar
-
 Romania
-
 Rwanda
-
 Saudi Arabia
-
 Serbia
-
 Singapore
-
 Slovakia
-
 Slovenia
-
 Somalia
-
 South Africa
-
 Spain
Spain
-
 Sri Lanka
-
 Sweden
-
 Switzerland
-
 Syrian Arab Republic
-
 Taiwan
-
 Tajikistan
-
 Tanzania, United Republic Of
-
 Thailand
-
 Trinidad and Tobago
-
 Tunisia
-
 Turkey
-
 UAE
UAE
-
 Uganda
-
 Ukraine
-
 United Kingdom
-
United States
-
 Uzbekistan
-
 Venezuela
-
 Vietnam
-
 Yemen
Yemen
-
 Zambia
-
 Zimbabwe
- Forex
- Crypto
