Understanding Housing Market Cycles And What Drives Them


Editorial Note: While we adhere to strict Editorial Integrity, this post may contain references to products from our partners. Here's an explanation for How We Make Money. None of the data and information on this webpage constitutes investment advice according to our Disclaimer.
Housing market cycles follow emotional and financial patterns that go far beyond simple supply-demand dynamics. They unfold in phases, from recovery to expansion, oversupply, and eventual downturn, driven by credit access, policy lags, and investor sentiment. Recognizing early signals like affordability strain, rising debt, or speculative buying is key to navigating these powerful economic shifts.
Housing market cycles are not driven by simple supply and demand charts. They are shaped by human behavior, credit design and policy reactions that usually arrive late. By the time most people recognize a housing boom it is already overheating. And when the bust begins the damage spreads beyond real estate into jobs credit and government balance sheets. These cycles are slow to build but brutal to unwind. Understanding them means looking past prices and watching the timing mismatch between policy moves and market emotions.
Understanding housing market cycles
The housing market, much like other financial markets, moves in cycles. Prices do not rise or fall indefinitely. Instead, they follow recognizable patterns influenced by economic conditions, buyer behavior, interest rates, and changes in supply and demand. Gaining a clear understanding of these cycles allows investors, homeowners, and policymakers to make more informed decisions about timing, strategy, and risk management.
Phases of a typical cycle

Housing markets tend to follow a four-phase cycle: recovery, expansion, hyper-supply, and downturn. Each phase has its own drivers, signals, and risks.
Recovery
Begins after a downturn when prices are low and demand is weak.
New construction is minimal and vacancy rates are high.
Investors with long-term views often enter the market quietly.
Rents may start to stabilize, signaling that the bottom is near.
Expansion
Demand increases, prices rise, and new construction picks up.
Job growth and income gains support more home buying activity.
Rental vacancies drop and rents begin to climb.
Consumer confidence in the housing market returns.
Hyper-supply
Supply starts to outpace demand as developers overbuild.
Inventory rises, price growth slows, and time-on-market increases.
Rents may flatten as vacancies climb again.
The market begins to show signs of saturation, even if prices are still high.
Downturn
Demand falls, prices correct, and construction activity slows.
Foreclosures and price cuts become more common.
Investor interest pulls back, and risk appetite shrinks.
The cycle prepares to reset for recovery.
Understanding where the market stands in this cycle is key for deciding when to buy, sell, or hold property assets.
Key indicators during each phase
Different data points can help you identify which phase the market is in. Watching these signs closely helps investors avoid mistimed decisions and policymakers respond early.
| Market Phase | Key Indicators |
|---|---|
| Recovery | High vacancy rates but gradually decliningFlat or slightly increasing rentsHome prices stabilizing after previous declinesGrowing investor interest in undervalued properties |
| Expansion | Steady job and income growthRising home prices and rental demandFaster absorption of available housing inventorySurge in new construction permits and housing starts |
| Hyper-Supply | Housing inventory rising faster than demandHome price growth slowing or stagnatingExcessive construction activityProperties remaining longer on the market |
| Downturn | Declining or stagnating home prices over several monthsFalling buyer interest and fewer mortgage approvalsRising defaults or foreclosuresDecline in construction and fewer new project launches |
Historical perspective on housing bubbles
Housing bubbles occur when prices rise far beyond the actual value supported by income, rent, or economic fundamentals. They are often fueled by easy credit, speculative buying, and investor overconfidence. While prices may soar for years, these bubbles tend to burst with damaging consequences for homeowners, banks, and the broader economy. One of the most impactful examples was the housing boom of the 2000s that led to the 2008 global financial crisis.
The 2000s housing boom and the 2008 crisis
In the early 2000s, the US housing market experienced a long stretch of rising home prices, fueled by low interest rates, rising demand, and financial innovation in the mortgage sector.
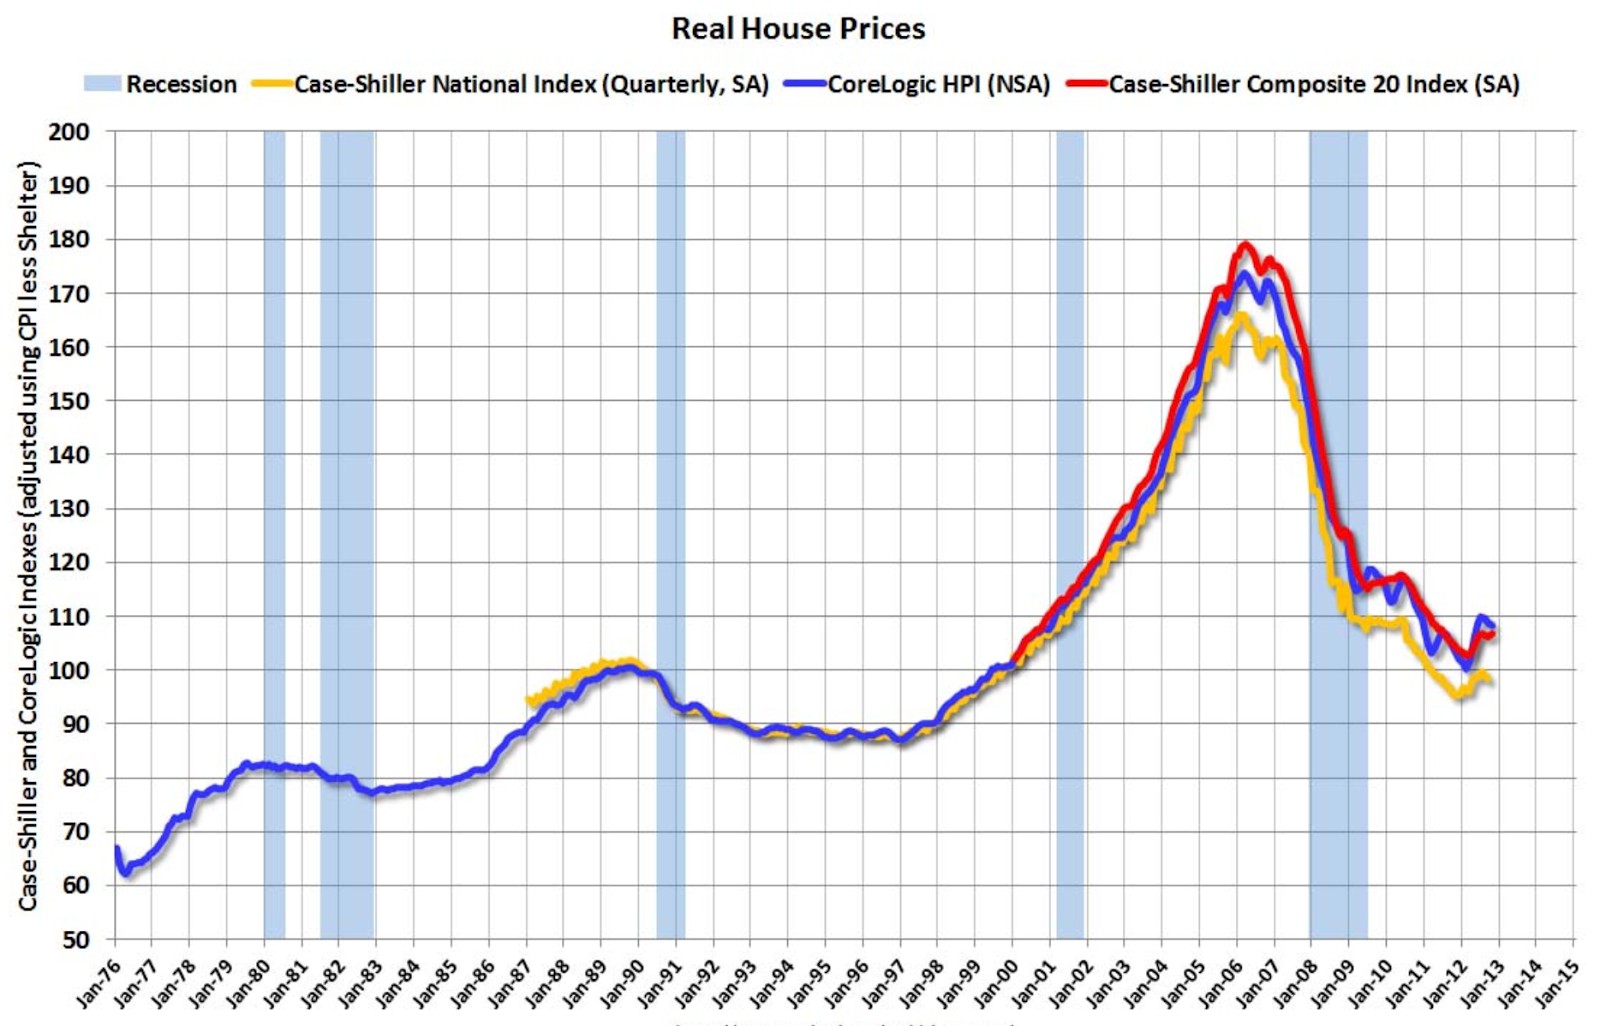
Following the dot-com bust and the 9/11 recession, interest rates were kept artificially low for an extended period. This made borrowing cheaper and significantly easier, even for high-risk borrowers who often secured loans with little or no down payment. Simultaneously, Wall Street banks bundled these mortgages into complex financial instruments – mortgage-backed securities – and sold them to investors around the world. Fueled by the widespread belief that housing prices would keep rising indefinitely, demand surged, pushing home values even higher and further inflating the bubble.
Eventually, interest rates began to rise, increasing the cost of mortgages and making it harder for many homeowners to meet their monthly payments – particularly those with adjustable-rate loans. As defaults increased, home prices began to flatten and then decline, eroding homeowner equity and triggering a cascade of foreclosures. Financial institutions heavily invested in mortgage-backed securities suffered massive losses, sending shockwaves through the global financial system.
The aftermath was devastating. Several major financial institutions either collapsed or required government bailouts to survive. Credit markets seized up, paralyzing lending and triggering a deep global recession. Millions of Americans lost their homes or saw their property values plunge. Within two years, the U.S. unemployment rate had doubled. The 2008 financial crisis became a stark global reminder of what can happen when unchecked financial optimism diverges from economic fundamentals.
Regulatory gaps and mortgage excesses before 2008
The 2008 financial crisis was not solely the result of falling home prices – it reflected deeper systemic failures in oversight, lending standards, and risk management. It exposed how unchecked financial innovation, combined with regulatory blind spots, could destabilize not just local markets but the global economy.
A significant part of the problem stemmed from how many mortgage lenders operated outside traditional banking regulations. These institutions issued risky subprime and adjustable-rate mortgages without being subject to rigorous supervision. Meanwhile, financial rating agencies granted high credit ratings to mortgage-backed securities that, in reality, carried substantial risk. At the same time, regulators failed to recognize just how interconnected and fragile the global financial system had become, allowing structural weaknesses to build up unnoticed.
Lending practices during the boom years became increasingly reckless. Many loans were approved without verifying a borrower's income or employment status. Adjustable-rate mortgages drew in homebuyers with low introductory payments, only to reset at far higher – and often unaffordable – levels. Investment banks then packaged these high-risk loans into complex financial products and distributed them globally, embedding fragility across multiple markets. As long as home prices continued to climb, there was little incentive to question these practices.
The lessons of 2008 remain highly relevant. The crisis illustrated how quickly housing markets can become overextended when credit is easily available and poorly regulated. It underscored the critical need for transparency, accountability, and strong oversight in mortgage lending. Perhaps most importantly, it reminded both investors and homeowners that rising prices can mask deeper vulnerabilities – and that understanding underlying risks is essential for long-term financial stability.
Post-crisis recovery and current dynamics
Following the 2008 housing crash, global markets underwent a prolonged recovery. In response, governments implemented stimulus measures, interest rates were significantly reduced, and central banks introduced unconventional monetary policies. Although housing markets eventually bounced back, the recovery also gave rise to new challenges. These included widening affordability gaps, rapid price escalation driven by investors, and uneven growth across different regions.
Market rebound and price escalation post-2009
By 2012, many major housing markets had stabilized. What followed was one of the strongest price rebounds in modern real estate history.
What fueled the recovery:
Central banks cut interest rates to record lows, making mortgages cheaper.
Governments launched stimulus programs and loan support schemes.
Real estate became attractive to investors seeking safer, yield-generating assets.
Urban population growth added steady demand in key cities.
How prices escalated:
Home prices in cities like Toronto, London, and Sydney more than doubled over the next decade.
Real estate investment trusts (REITs) and global capital flowed into residential property.
Investors bought second homes or rental properties, competing with first-time buyers.
New construction lagged behind demand, especially in urban areas, pushing prices even higher.
Emerging concerns:
Affordability worsened for middle-income and younger buyers.
Household debt levels rose in many countries.
Housing inequality grew, as asset-rich owners benefited from rising values.
Current global housing price trends
The last few years have added new complexity to housing markets, shaped by post-pandemic shifts, rising interest rates, and regional imbalances.
Between 2020 and 2022, low rates and remote work policies triggered a housing surge in many countries. Prices rose rapidly in the US, Canada, Germany, and parts of Asia. By 2023, central banks began hiking rates to control inflation, leading to cooling in overheated markets. Some cities saw price drops or stagnation, while others remained elevated due to tight supply.
Markets like India and Southeast Asia have shown steady growth backed by demographics and urbanization. China’s housing sector faces pressure due to oversupply and regulatory tightening. The US market shows mixed signals with affordability declining but supply still tight. Europe sees fragmented trends, with Eastern Europe still growing while parts of Western Europe slow.
New forces shaping the market:
Institutional investors continue buying single-family homes in select regions.
Governments are intervening more with taxes on second homes and tighter lending rules.
Climate risk, remote work, and demographic shifts are influencing long-term demand patterns.
How today compares with pre-2008 conditions
With home prices once again reaching record levels in many countries, it’s natural to ask whether we are repeating the same mistakes that led to the 2008 housing crash. While there are some surface-level similarities, today’s housing market operates under very different rules and conditions. Comparing the two periods helps investors, buyers, and policymakers stay alert without falling into panic.
Similarities in price surges and borrowing patterns
Certain trends today do resemble the years leading up to the 2008 crisis, especially the sharp rise in home prices and the growing role of credit in fueling purchases.
Many urban markets have seen home values rise by 50 to 100 percent over the last decade. Low interest rates between 2020 and 2022 made borrowing cheaper, boosting demand. Bidding wars, limited inventory, and investor activity pushed prices up rapidly
Borrowing trends:
Mortgage volumes increased significantly during the pandemic housing boom.
First-time buyers often stretched finances to enter the market.
Investors and corporate buyers added competitive pressure by purchasing multiple units.
In some markets, household debt levels are now near or above 2008 levels.
Differences in regulation, lending standards, and risk buffers
Despite the similarities, today’s housing market has much stronger guardrails in place. Stricter oversight, smarter lending practices, and improved financial regulation have made the system more resilient.
Lending practices:
Most mortgages today go through tighter income verification and credit checks.
Risky products like no-document loans and interest-only loans are far less common.
Loan-to-value ratios are capped in many countries to prevent overleveraging.
Regulatory oversight:
Banks now operate under stricter capital requirements and stress testing rules.
Credit agencies and regulators monitor mortgage-backed securities more closely.
Many governments have macroprudential tools in place, such as debt-to-income caps and foreign buyer taxes.
Risk buffers in the system:
Borrowers are generally better capitalized, with higher down payments than in 2006.
Lenders have improved balance sheets and liquidity positions.
Governments are quicker to step in with policy tools to cool overheating markets.
While prices and debt levels are rising again, the system is far more aware and better prepared than it was in the lead-up to 2008.
Warning signs of overheating markets
Even in stable economic periods, housing markets can run too hot. When prices rise faster than incomes, borrowing increases too quickly, or speculation becomes widespread, the risk of a sharp correction grows. Recognizing these red flags early can help investors and policymakers avoid the kind of collapse seen in past housing bubbles.
Declining housing affordability
One of the clearest signals of overheating is when home prices rise much faster than income levels.
Measuring affordability stress:
The price-to-income ratio has reached record highs in many major cities.
In some urban centers, buying a median-priced home now requires over 8 to 10 times the average annual income.
Rent-to-income ratios are also rising, putting pressure on non-owners and first-time buyers.
Impact on buyers and renters:
Households are forced to borrow more or delay purchases.
Younger buyers and middle-income families are increasingly locked out of ownership.
Renters face rising costs without matching increases in earnings.
When affordability falls too far, demand can drop quickly, leading to price corrections and stalled construction.
Escalating household debt and mortgage stress
Another danger sign is when families take on more debt than they can safely handle, especially during periods of rising interest rates.
Where the pressure shows:
Household debt-to-income ratios have climbed sharply in countries like Canada, South Korea, and Australia.
Mortgage payments now take up a larger share of income due to both high prices and rising rates.
Variable-rate borrowers face immediate payment shocks when central banks tighten policy.
Financial risks ahead:
Higher monthly payments increase the risk of missed installments or defaults.
If home prices fall, households with high leverage may face negative equity.
Debt stress weakens consumer spending, which can affect the broader economy.
Rise in speculative investments
Housing becomes especially risky when investors enter the market not to live in homes, but to flip them or chase quick gains.
Signs of growing speculation:
Increase in short-term resales or flipping activity.
Higher share of mortgages going to second-home or investment buyers.
Real estate hype on social media and “fear of missing out” behavior driving demand.
Risks posed by speculation:
Investors often sell quickly during downturns, amplifying price declines.
Short-term speculation can distort housing supply and push out long-term residents.
Over-reliance on capital gains rather than rental income creates market instability.
Housing cycles also greatly influence how investors look at other assets. So, it can be a good fundamental indicator for investing in stocks, Forex, or crypto. If you wish to try out this strategy, you would need an account with a broker that offers a wide range of assets. Some of the brokers that fit this criteria are presented in the table below for your comparison.
| zForex | Plus500 | Trading.com USA | OANDA | FOREX.com | |
|---|---|---|---|---|---|
|
Currency pairs |
50 | 60 | 69 | 68 | 80 |
|
Crypto |
Yes | Yes | No | Yes | Yes |
|
Stocks |
Yes | Yes | No | Yes | Yes |
|
Min. deposit, $ |
10 | 100 | 50 | No | 100 |
|
Max. leverage |
1:1000 | 1:300 | 1:50 | 1:200 | 1:50 |
|
Regulation |
No | CySEC, FCA, ASIC, FMA, FSCA, FSA Seychelles, EFSA, MAS, DFSA, SCB | CFTC, NFA | FSC (BVI), ASIC, IIROC, FCA, CFTC, NFA | CIMA, FCA, FSA (Japan), NFA, IIROC, ASIC, CFTC |
|
TU overall score |
7.89 | 7.52 | 6.81 | 6.8 | 6.74 |
|
Open an account |
Go to broker Your capital is at risk.
|
Go to broker 80% of retail CFD accounts lose money. |
Go to broker Your capital is at risk. |
Go to broker Your capital is at risk. |
Study review |
Market turns begin with belief, not rates

Many assume that rising interest rates alone cause housing crashes. But that is only part of the story. The real shift begins when confidence in the market starts to fade. As long as people believe prices will keep rising, they are willing to accept higher mortgage costs. But once that belief weakens, even small rate increases can lead to large-scale exits. That is why it is more important to monitor market sentiment than interest rates alone. Pay close attention to how quickly listings are building up, how long homes are sitting unsold, and when developers start pulling back. These signals often emerge before prices actually fall. They show what buyers and builders are truly thinking beneath the surface.
Another common misunderstanding is how long housing bottoms tend to last. Crashes feel fast, but recoveries move slowly. Sellers do not want to accept losses, buyers wait for better deals, and lending becomes more difficult just when people need it most. What eventually revives the market is not only lower rates, but a shift in emotion is when hesitation turns into urgency. When buyers stop negotiating and start rushing in, that is your sign the cycle is turning. Until then, the silence in the market is not stable. It is pressure quietly building toward the next move.
Conclusion
In sum, the housing market is profoundly shaped by the interplay of credit availability, collective sentiment, and the timing of government policies. Recognizing these driving forces not only demystifies periods of rapid boom, such as the mid-2000s housing bubble, but also helps explain abrupt downturns when lending tightens and optimism fades. Understanding these cycles empowers buyers, investors, and policymakers to make better, more informed decisions. Ultimately, those who grasp the rhythm of market forces are far better equipped to navigate the inevitable ups and downs with resilience and foresight.
FAQs
How can individuals identify which phase of the housing market cycle their local market is in?
What are the main risks of ignoring early signals of a shifting housing market?
How have lending standards and regulation changed since the 2008 financial crisis?
Why does housing affordability remain a concern even during periods of market recovery or expansion?
Editors' Top Picks and Insights

Hunting crypto owners: Why criminals have gone offline

BitMEX is shutting down: Why Trump could not save the exchange

Do governments need crypto workers?

Brent nears $100: Why oil prices are rising

Gram Wallet launch: Can Telegram bring crypto to the masses?

AI without limits: How dangerous are neural networks?
Related Articles
Team that worked on the article
Anton Kharitonov is an active trader and analyst. He employs both short- and long-term trading strategies, primarily based on fundamental factors, supported by technical indicators and intermarket analysis.
One of the most widely respected and quoted currency experts, Marc Chandler has been analyzing and advising on the global capital markets for more than 30 years. Throughout his career on Wall Street, Chandler has advised private businesses, hedge funds and asset managers on navigating the foreign exchange market.
Chinmay Soni is a financial analyst with more than 5 years of experience in working with stocks, Forex, derivatives, and other assets. As a founder of a boutique research firm and an active researcher, he covers various industries and fields, providing insights backed by statistical data.
Forex leverage is a tool enabling traders to control larger positions with a relatively small amount of capital, amplifying potential profits and losses based on the chosen leverage ratio.
Risk management is a risk management model that involves controlling potential losses while maximizing profits. The main risk management tools are stop loss, take profit, calculation of position volume taking into account leverage and pip value.
Yield refers to the earnings or income derived from an investment. It mirrors the returns generated by owning assets such as stocks, bonds, or other financial instruments.
An investor is an individual, who invests money in an asset with the expectation that its value would appreciate in the future. The asset can be anything, including a bond, debenture, mutual fund, equity, gold, silver, exchange-traded funds (ETFs), and real-estate property.
Index in trading is the measure of the performance of a group of stocks, which can include the assets and securities in it.

-
 Afghanistan
-
 Albania
-
 Algeria
-
 Angola
-
 Argentina
-
 Armenia
-
 Australia
-
 Austria
-
 Azerbaijan
-
 Bahamas
-
 Bahrain
-
 Bangladesh
-
 Belarus
-
 Belgium
-
 Bolivia
-
 Botswana
-
 Brazil
-
 Brunei
-
 Bulgaria
-
 Cambodia
-
 Cameroon
-
 Canada
-
 Chile
Chile
-
 China
China
-
 Colombia
-
 Congo
Congo
-
 Costa Rica
-
 Cote d'Ivoire
-
 Croatia
-
 Cuba
Cuba
-
 Cyprus
-
 Czechia
-
 DR Congo
-
 Denmark
-
 Dominican Republic
-
 Ecuador
-
 Egypt
Egypt
-
 El Salvador
-
 Estonia
-
 Eswatini
-
 Ethiopia
-
 Finland
-
 France
-
 Georgia
-
 Germany
-
 Ghana
Ghana
-
 Greece
-
 Haiti
Haiti
-
 Hong Kong
-
 Hungary
-
 India
India
-
 Indonesia
-
 Iran, Islamic republic
-
 Iraq
Iraq
-
 Ireland
-
 Israel
-
 Italy
Italy
-
 Jamaica
-
 Japan
Japan
-
 Jordan
-
 Kazakhstan
-
 Kenya
Kenya
-
 Korea
Korea
-
 Kuwait
-
 Kyrgyzstan
-
 Laos
Laos
-
 Latvia
-
 Lebanon
-
 Lesotho
-
 Libya
Libya
-
 Lithuania
-
 Luxembourg
-
 Madagascar
-
 Malaysia
-
 Malta
Malta
-
 Mauritius
-
 Mexico
-
 Moldova
-
 Mongolia
-
 Montenegro
-
 Morocco
-
 Mozambique
-
 Myanmar
-
 Namibia
-
 Nepal
Nepal
-
 Netherlands
-
 New Zealand
-
 Nigeria
-
 North Macedonia
-
 Norway
-
 Oman
Oman
-
 Pakistan
-
 Palestine
-
 Panama
-
 Papua New Guinea
-
 Paraguay
-
 Peru
Peru
-
 Philippines
-
 Poland
-
 Portugal
-
 Puerto Rico
-
 Qatar
Qatar
-
 Reunion
-
 Romania
-
 Rwanda
-
 Saudi Arabia
-
 Serbia
-
 Singapore
-
 Slovakia
-
 Slovenia
-
 Somalia
-
 South Africa
-
 Spain
Spain
-
 Sri Lanka
-
 Sweden
-
 Switzerland
-
 Syria
Syria
-
 Taiwan
-
 Tajikistan
-
 Tanzania
-
 Thailand
-
 Trinidad and Tobago
-
 Tunisia
-
 Turkey
-
 UAE
UAE
-
 Uganda
-
 Ukraine
-
 United Kingdom
-
United States
-
 Uruguay
-
 Uzbekistan
-
 Venezuela
-
 Vietnam
-
 Yemen
Yemen
-
 Zambia
-
 Zimbabwe
- Forex
- Crypto
