
What is a Timeframe in Trading?


Editorial Note: While we adhere to strict Editorial Integrity, this post may contain references to products from our partners. Here's an explanation for How We Make Money. None of the data and information on this webpage constitutes investment advice according to our Disclaimer.
A timeframe in trading is the period of time represented by each candle or bar on a price chart. For example, each candle on a 5-minute chart shows five minutes of price activity, while each candle on a daily chart shows one day. Trading timeframes range from seconds and minutes to hours, days, weeks and months, giving traders and investors different views of the same market.
Every trading chart has a timeframe, which determines how price activity is grouped and how much detail you see. The same price move can look significant on a one-minute chart but barely noticeable on a daily chart. This article explains what trading timeframes are, the main types, how shorter and longer timeframes differ, and how traders and investors can choose and combine them.
What is a timeframe in trading?
A timeframe is the period of time represented by each candle, bar or other element on a trading chart. It determines how price data is grouped and displayed.
For example, on a 15-minute candlestick chart, each completed candle shows what happened to the price during those 15 minutes. A standard candle shows four prices:
Open: the price at the beginning of the interval;
High: the highest price reached during the interval;
Low: the lowest price reached during the interval;
Close: the price at the end of the interval.
The same timeframe can also be displayed using different types of charts. A line chart, for example, usually connects the closing price from each interval instead of showing all four prices.
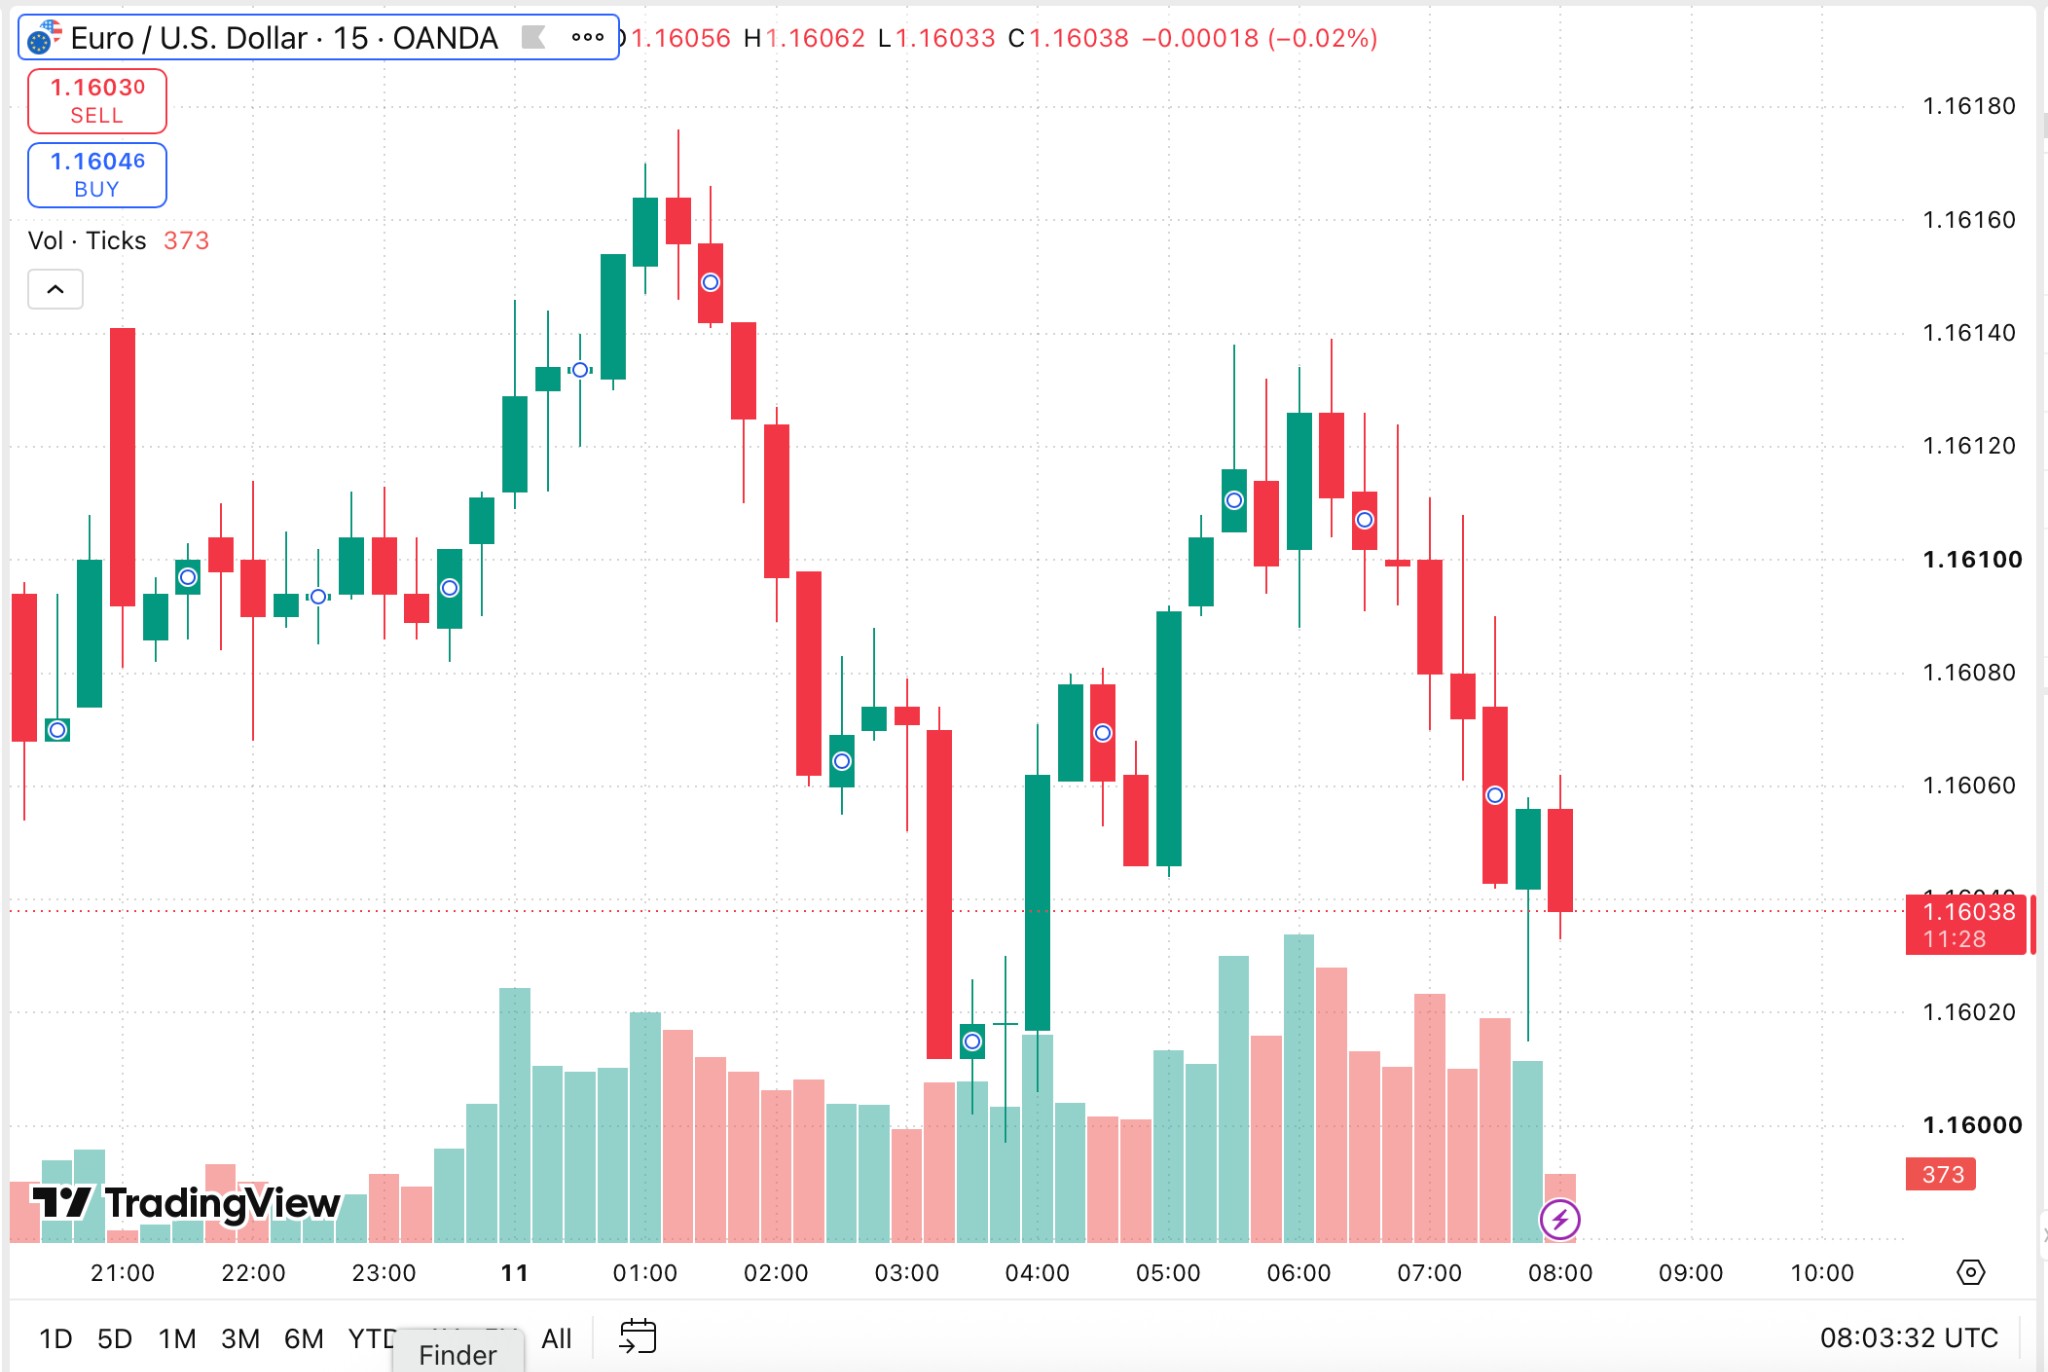
In simple terms, the time frame in trading determines how price activity is divided and displayed on a chart. Shorter timeframes show price movements in greater detail, making smaller changes easier to see. Longer timeframes combine more price activity into each candle or bar, making it easier to see the broader market picture.
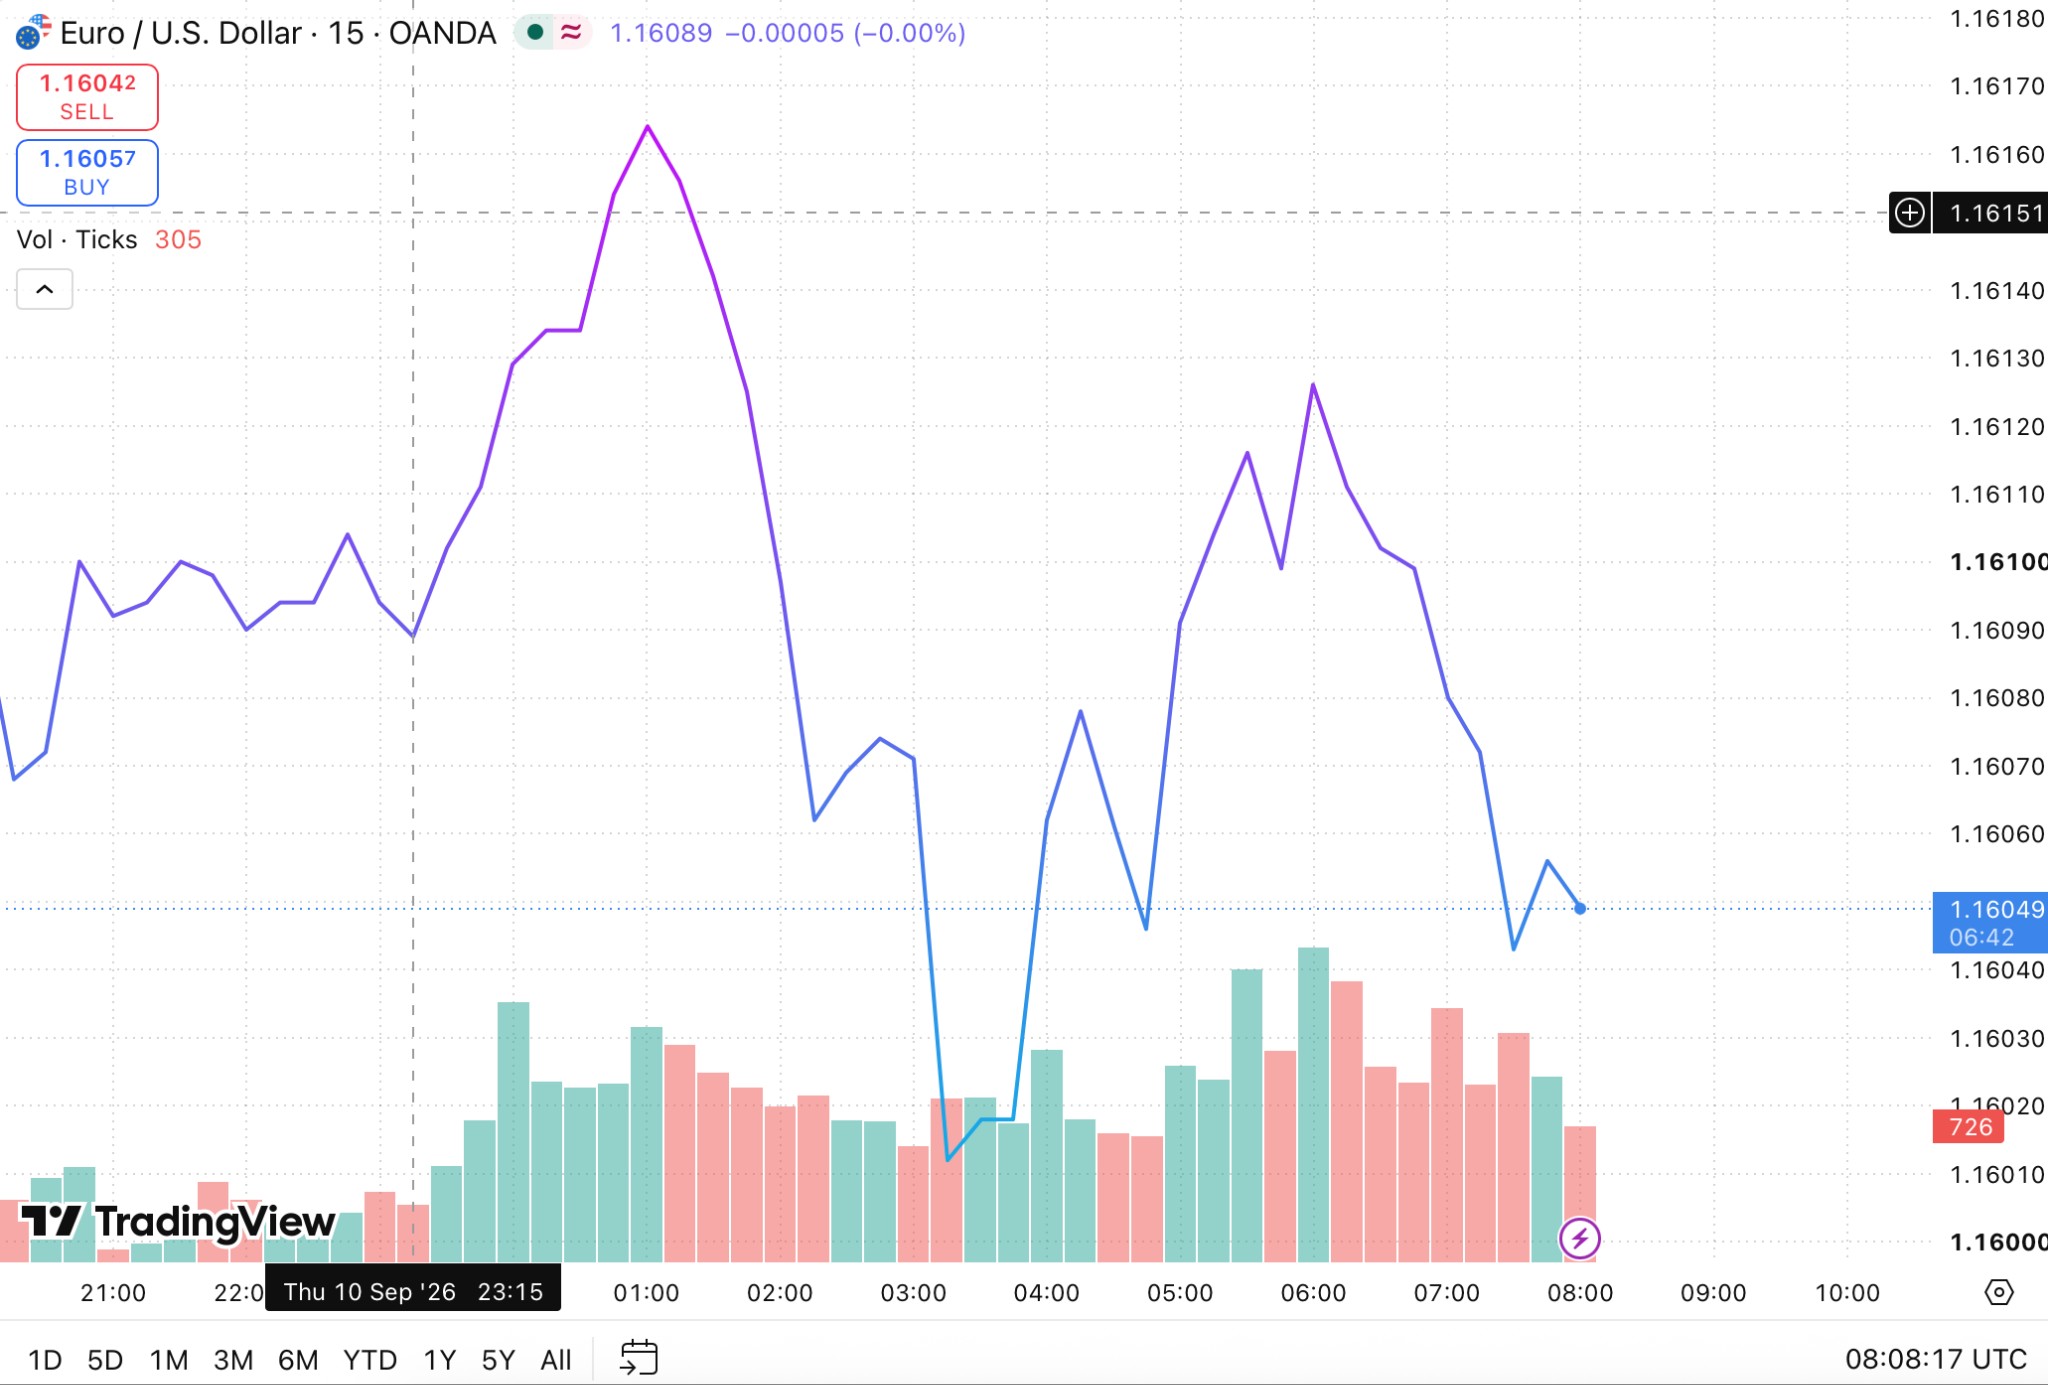
What are the main trading timeframes?
Trading timeframes range from seconds and minutes to hours, days, weeks and months. They can be broadly grouped into short-, medium- and long-term intervals, although there is no universal dividing line between these categories. The classification mainly helps traders understand how the amount of chart detail, trading pace and typical use change as the timeframe becomes longer.
Short-term timeframes
Short-term timeframes generally include minute-based charts such as M1, M5 and M15. They show price movement in considerable detail and are commonly used for scalping and other active trading strategies. Prices can change quickly, many potential signals may appear within a session and short-term market noise is more visible, so these intervals typically require closer monitoring and faster decisions.
Medium-term timeframes
Intervals such as M30, H1 and H4 provide a broader view of price movement while retaining more detail than daily or weekly charts. They are commonly used for intraday and swing trading, where positions may remain open from several hours to several days. With fewer small fluctuations dominating the chart, trends, price structure and important levels can be easier to distinguish.
Long-term timeframes
Daily, weekly and monthly charts show price movement over much longer periods. Smaller fluctuations become less prominent, making broader trends and market cycles easier to see. These timeframes are commonly used for position trading, longer-term market analysis and investing.
| Timeframe | Interval | General category | Common use |
|---|---|---|---|
| M1 | 1 minute | Short-term | Scalping, very short-term trades |
| M5 | 5 minutes | Short-term | Scalping, active trading |
| M15 | 15 minutes | Short-term | Short-term intraday trading |
| M30 | 30 minutes | Medium-term | Intraday trading |
| H1 | 1 hour | Medium-term | Intraday trading |
| H4 | 4 hours | Medium-term | Swing trading |
| D1 | 1 day | Long-term | Position trading |
| W1 | 1 week | Long-term | Trend analysis, investing |
| MN | 1 month | Long-term | Long-term trends and investing |
These categories describe how the chart is organized, not how long a trade must remain open. Using a daily chart does not mean a position has to stay open for exactly one day, and traders may classify the same interval differently depending on their strategy and trading horizon.
How does a timeframe change what you see on a chart?
Changing the timeframe on a trading chart is similar to zooming in or out. Shorter timeframes divide price activity into many small intervals, showing more detail, while longer timeframes combine the same activity into fewer chart elements.
Consider the same six hours of trading:
A 1-minute chart contains 360 one-minute intervals;
A 5-minute chart contains 72 intervals;
A 15-minute chart contains 24 intervals;
A 1-hour chart contains six intervals;
A 6-hour chart can show the entire period in a single candle.
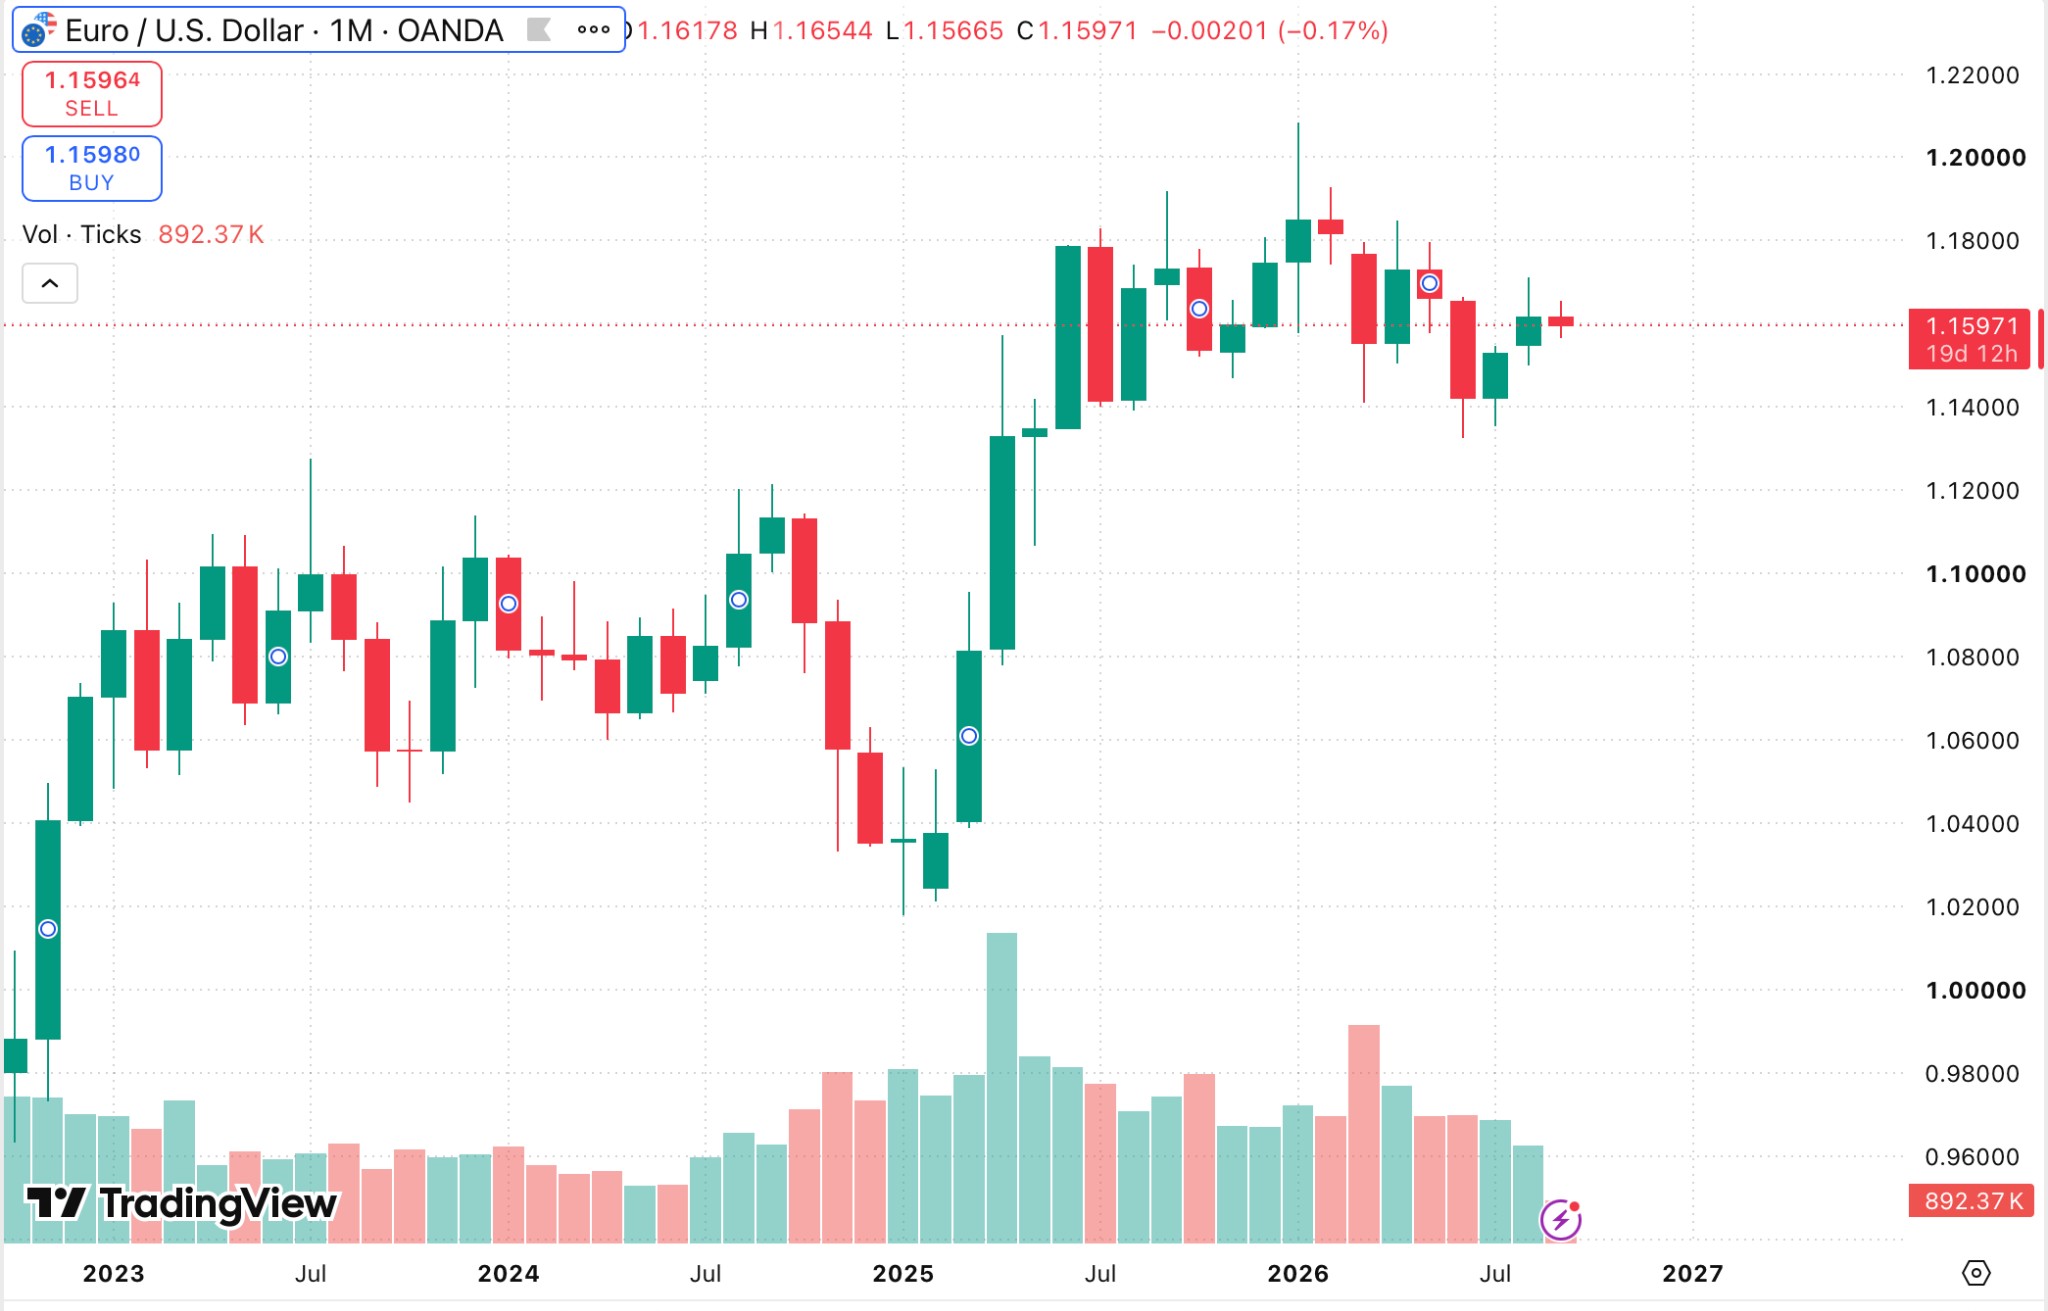
All five charts can show the same six hours of price activity. The difference is how much detail you can see. This is why different timeframes can seem to tell different stories. A market may be rising over several weeks while falling during the last few hours. On a weekly chart, that decline may appear as a small pullback within a larger uptrend. On an hourly chart, the same move may look like a clear short-term downtrend.
The timeframe can also affect how traders identify support and resistance, trends and chart patterns. For example, a price level that has developed over several months has a different market context from one that is visible for only a few minutes.
How timeframes relate to trading styles
A timeframe and a trading style are closely related, but they are not the same thing. A timeframe determines how price data is displayed on a chart, while a trading style describes how a trader approaches the market, including how long positions are typically held.
| Trading style | Commonly used timeframes | Typical holding period |
|---|---|---|
| Scalping | Seconds to several minutes | Seconds to minutes |
| Day trading | Minutes to hours | Minutes to one trading session |
| Swing trading | Hours to daily charts | Several days to weeks |
| Position trading | Daily to weekly charts | Weeks to months |
| Long-term investing | Daily, weekly and monthly charts | Months to years |
These are general guidelines rather than fixed rules. A day trader may check a daily chart for the broader market picture before moving to an hourly or minute chart, while a swing trader may use a weekly chart to see the longer-term trend.
Likewise, simply using a one-minute chart does not make someone a scalper. Trading style is defined by the overall strategy and typical holding period, not by a single chart timeframe.
How to choose a timeframe for trading
There is no single best trading timeframe. The most useful interval depends on the strategy, expected holding period and the type of market movement that matters for the decision. This is why the time frame for traders and investors can differ considerably: a short-term trader may focus on minute or hourly charts, while a long-term investor is more likely to rely on daily, weekly or monthly timeframes.
Important factors include:
Expected holding period. Shorter trades generally require more detailed charts, while longer positions usually need a broader view. The chart timeframe does not have to match the holding period exactly.
Trading strategy. Strategies built around rapid price changes require different intervals from those focused on larger trends.
Available time. Very short timeframes can require frequent monitoring and faster decisions.
Market volatility. The same timeframe can show very different amounts of price movement as market conditions change.
Trading frequency. Someone looking for several opportunities during a session needs a different level of detail from someone making occasional decisions.
Market characteristics. Liquidity and trading hours can affect the usefulness of an interval.
Personal decision-making. Some traders are comfortable responding to rapid changes, while others prefer more time to analyze a setup.
How to use multiple timeframes in trading
Multiple-timeframe analysis means comparing two or more chart intervals to understand price movement from different perspectives. Rather than treating every timeframe the same way, traders can give each one a specific purpose:
Higher timeframe: identify the broader trend, market structure and important price levels;
Main timeframe: analyze the trading setup and make the main trading decision;
Lower timeframe: look at recent price action in more detail and refine entry or exit timing.
For example, a trader using a four-hour chart as the main timeframe might check the daily chart for the broader market picture and the one-hour chart for more detail. There is no fixed combination. Shorter-term strategies may use minutes and hours, while longer-term approaches may combine daily, weekly and monthly charts.
Different timeframes can also give different signals. An hourly chart may show prices falling while the weekly chart still shows an uptrend because each chart covers a different period. This is why it is useful to decide in advance what purpose each timeframe serves rather than switching between charts until they appear to agree.
Using more timeframes does not necessarily make the analysis better. Two or three timeframes with clearly defined purposes are usually easier to interpret than a large number of charts showing overlapping or conflicting information.
Do timeframes work differently across markets?
The basic meaning of a timeframe is the same across financial markets: it determines the period used to group and display price data. A 15-minute timeframe always represents 15 minutes, whether the chart shows a currency pair, stock, commodity, cryptocurrency or another traded instrument.
However, there are some practical differences because markets operate in different ways:
Trading hours: some markets operate continuously or almost continuously, while others follow fixed trading sessions;
Weekends and holidays: market closures can affect how daily and weekly periods are formed;
Liquidity: very short timeframes may be less useful in markets with low trading activity;
Volatility: the amount of price movement within the same timeframe can vary significantly between markets;
Data sources: prices and candle boundaries may differ slightly between data providers;
Available intervals: some platforms offer seconds-based and custom timeframes, while others provide only standard options.
The meaning of a timeframe is therefore consistent across asset classes, but how useful a particular interval is can depend on the market being analyzed.
Common mistakes when using trading timeframes
Timeframes are simple to understand, but using them inconsistently can make market analysis more confusing than it needs to be.
Common mistakes include:
Using a timeframe that does not match the strategy. A very short timeframe can distract from the bigger picture when a position is intended to last for weeks;
Ignoring higher timeframes. Focusing only on recent price movement can make traders miss important longer-term trends and price levels;
Switching timeframes to confirm a trade. Moving between charts until one supports an existing view can lead to confirmation bias;
Using too many timeframes. Following too many chart intervals can create unnecessary or conflicting information;
Overreacting to market noise. Small price movements on shorter timeframes can appear more important than they really are.
A practical approach is to choose the main timeframe in advance and have a clear reason for using any additional timeframes.
Best Forex brokers
Forex traders may use different timeframes depending on their strategies, so a broker's platform should provide the chart intervals and analytical tools they need. Trading costs, execution, available currency pairs and regulation also matter when choosing a broker. Comparing these factors can help traders find a broker that fits both their trading strategy and practical requirements.
| Plus500 | OANDA | Trading.com USA | FOREX.com | IG Markets | |
|---|---|---|---|---|---|
|
Currency pairs |
60 | 68 | 69 | 80 | 80 |
|
Min. deposit, $ |
100 | No | 50 | 100 | 1 |
|
Max. leverage |
1:300 | 1:200 | 1:50 | 1:50 | 1:200 |
|
Min Spread EUR/USD, pips |
0.5 | 0.1 | 0.9 | 0.7 | 0.6 |
|
Demo |
Yes | Yes | Yes | Yes | Yes |
|
TU overall score |
7.7 | 7.24 | 6.22 | 7.12 | 7.04 |
|
Open an account |
Go to broker 81% of retail CFD accounts lose money. |
Go to broker Your capital is at risk. |
Go to broker Your capital is at risk. |
Study review | Study review |
Use timeframes to separate context from detail

A timeframe is not a trading signal on its own. I see it mainly as a way to organize market information and keep analysis consistent. Constantly switching between timeframes can become a problem because it is often possible to find a chart that supports almost any trading idea.
I prefer to decide in advance which timeframe will provide the main market view and what purpose any additional timeframe will serve. A longer timeframe can show the broader market context, while a shorter one can provide more detail. The key is to give each timeframe a clear purpose rather than switching between charts whenever the market moves against the original view.
Conclusion
Mastering timeframes is essential for effective trading, as they provide the crucial foundation for interpreting market movements at every level of detail. Whether you're a scalper focusing on one-minute charts or a long-term investor relying on daily or monthly charts, using the right timeframe ensures your analysis aligns with your trading strategy. For example, a swing trader combining four-hour and daily charts can spot both prevailing trends and timely entry points. Remember, clarity comes from purposefully selecting timeframes to separate big-picture context from market noise, not from constantly switching charts in search of confirmation.
FAQs
What are the key benefits of combining multiple trading timeframes in market analysis?
How does market volatility influence the choice of trading timeframes?
Can using too many timeframes at once negatively impact trading decisions?
Why is it important to align trading strategies with appropriate timeframes?
Editors' Top Picks and Insights






Related Articles
Team that worked on the article
Aleksandra Chaikina has been a contributor to Traders Union since 2021. With over 15 years of experience in copywriting and more than 5 years focused on financial content, she specializes in producing detailed guides, analytics, and comparative reviews across various sectors, including cryptocurrencies, Forex, investment strategies, and financial technologies.
Ciaran Ryan is a veteran financial journalist based in South Africa, where he covers cryptocurrency, mining, stock markets, and governance for Moneyweb. He also hosts the weekly Moneyweb Crypto Podcast.
Chinmay Soni is a financial analyst with more than 5 years of experience in working with stocks, Forex, derivatives, and other assets. As a founder of a boutique research firm and an active researcher, he covers various industries and fields, providing insights backed by statistical data.
Forex leverage is a tool enabling traders to control larger positions with a relatively small amount of capital, amplifying potential profits and losses based on the chosen leverage ratio.
Bitcoin is a decentralized digital cryptocurrency that was created in 2009 by an anonymous individual or group using the pseudonym Satoshi Nakamoto. It operates on a technology called blockchain, which is a distributed ledger that records all transactions across a network of computers.
Index in trading is the measure of the performance of a group of stocks, which can include the assets and securities in it.
Swing trading is a trading strategy that involves holding positions in financial assets, such as stocks or forex, for several days to weeks, aiming to profit from short- to medium-term price swings or "swings" in the market. Swing traders typically use technical and fundamental analysis to identify potential entry and exit points.
Position trading is a long-term strategy where traders hold positions for extended periods, often weeks or months, based on fundamental analysis of an asset's value.

-
 Afghanistan
-
 Albania
-
 Algeria
-
 Angola
-
 Argentina
-
 Armenia
-
 Australia
-
 Austria
-
 Azerbaijan
-
 Bahamas
-
 Bahrain
-
 Bangladesh
-
 Belarus
-
 Belgium
-
 Bolivia
-
 Botswana
-
 Brazil
-
 Brunei
-
 Bulgaria
-
 Cambodia
-
 Cameroon
-
 Canada
-
 Chile
-
 China
-
 Colombia
-
 Congo
-
 Costa Rica
-
 Cote d'Ivoire
-
 Croatia
-
 Cuba
-
 Cyprus
-
 Czechia
-
 DR Congo
-
 Denmark
-
 Dominican Republic
-
 Ecuador
-
 Egypt
-
 El Salvador
-
 Estonia
-
 Eswatini
-
 Ethiopia
-
 Finland
-
 France
-
 Georgia
-
 Germany
-
 Ghana
-
 Greece
-
 Haiti
-
 Hong Kong
-
 Hungary
-
 India
-
 Indonesia
-
 Iran, Islamic republic
-
 Iraq
-
 Ireland
-
 Israel
-
 Italy
-
 Jamaica
-
 Japan
-
 Jordan
-
 Kazakhstan
-
 Kenya
-
 Korea
-
 Kuwait
-
 Kyrgyzstan
-
 Laos
-
 Latvia
-
 Lebanon
-
 Lesotho
-
 Libya
-
 Lithuania
-
 Luxembourg
-
 Madagascar
-
 Malaysia
-
 Malta
-
 Mauritius
-
 Mexico
-
 Moldova
-
 Mongolia
-
 Montenegro
-
 Morocco
-
 Mozambique
-
 Myanmar
-
 Namibia
-
 Nepal
-
 Netherlands
-
 New Zealand
-
 Nigeria
-
 North Macedonia
-
 Norway
-
 Oman
-
 Pakistan
-
 Palestine
-
 Panama
-
 Papua New Guinea
-
 Paraguay
-
 Peru
-
 Philippines
-
 Poland
-
 Portugal
-
 Puerto Rico
-
 Qatar
-
 Reunion
-
 Romania
-
 Rwanda
-
 Saudi Arabia
-
 Serbia
-
 Singapore
-
 Slovakia
-
 Slovenia
-
 Somalia
-
 South Africa
-
 Spain
-
 Sri Lanka
-
 Sweden
-
 Switzerland
-
 Syria
-
 Taiwan
-
 Tajikistan
-
 Tanzania
-
 Thailand
-
 Trinidad and Tobago
-
 Tunisia
-
 Turkey
-
 UAE
-
 Uganda
-
 Ukraine
-
 United Kingdom
-
United States
-
 Uruguay
-
 Uzbekistan
-
 Venezuela
-
 Vietnam
-
 Yemen
-
 Zambia
-
 Zimbabwe
- Forex
- Crypto










- What is a timeframe in trading?
- What are the main trading timeframes?
- How does a timeframe change what you see on a chart?
- How timeframes relate to trading styles
- How to choose a timeframe for trading
- How to use multiple timeframes in trading
- Do timeframes work differently across markets?
- Common mistakes when using trading timeframes
- Best Forex brokers
- Expert opinion
- Conclusion
- FAQs


