How To Use The Chaikin Oscillator To Track Real Market Momentum


Editorial Note: While we adhere to strict Editorial Integrity, this post may contain references to products from our partners. Here's an explanation for How We Make Money. None of the data and information on this webpage constitutes investment advice according to our Disclaimer.
The Chaikin oscillator is a volume-based momentum indicator that reveals real buying or selling pressure before price action confirms it. By tracking the difference between short and long EMAs of the Accumulation Distribution line, it highlights trend strength, potential reversals, and confirms breakouts with volume. It is most effective when used with price structure and other tools.
The Chaikin oscillator is more than a momentum tool that uses volume. It helps you spot when traders are serious and when a move has real weight behind it. While most indicators follow price, this one picks up early signs of strength by tracking how buying or selling pressure builds before the chart reacts. It mixes quick bursts with deeper pressure to show you if a move has real backing or if it is running out of steam. In this article, we will take a detailed look into this indicator, covering its origin, calculation, and top strategies.
Introduction to Chaikin oscillator
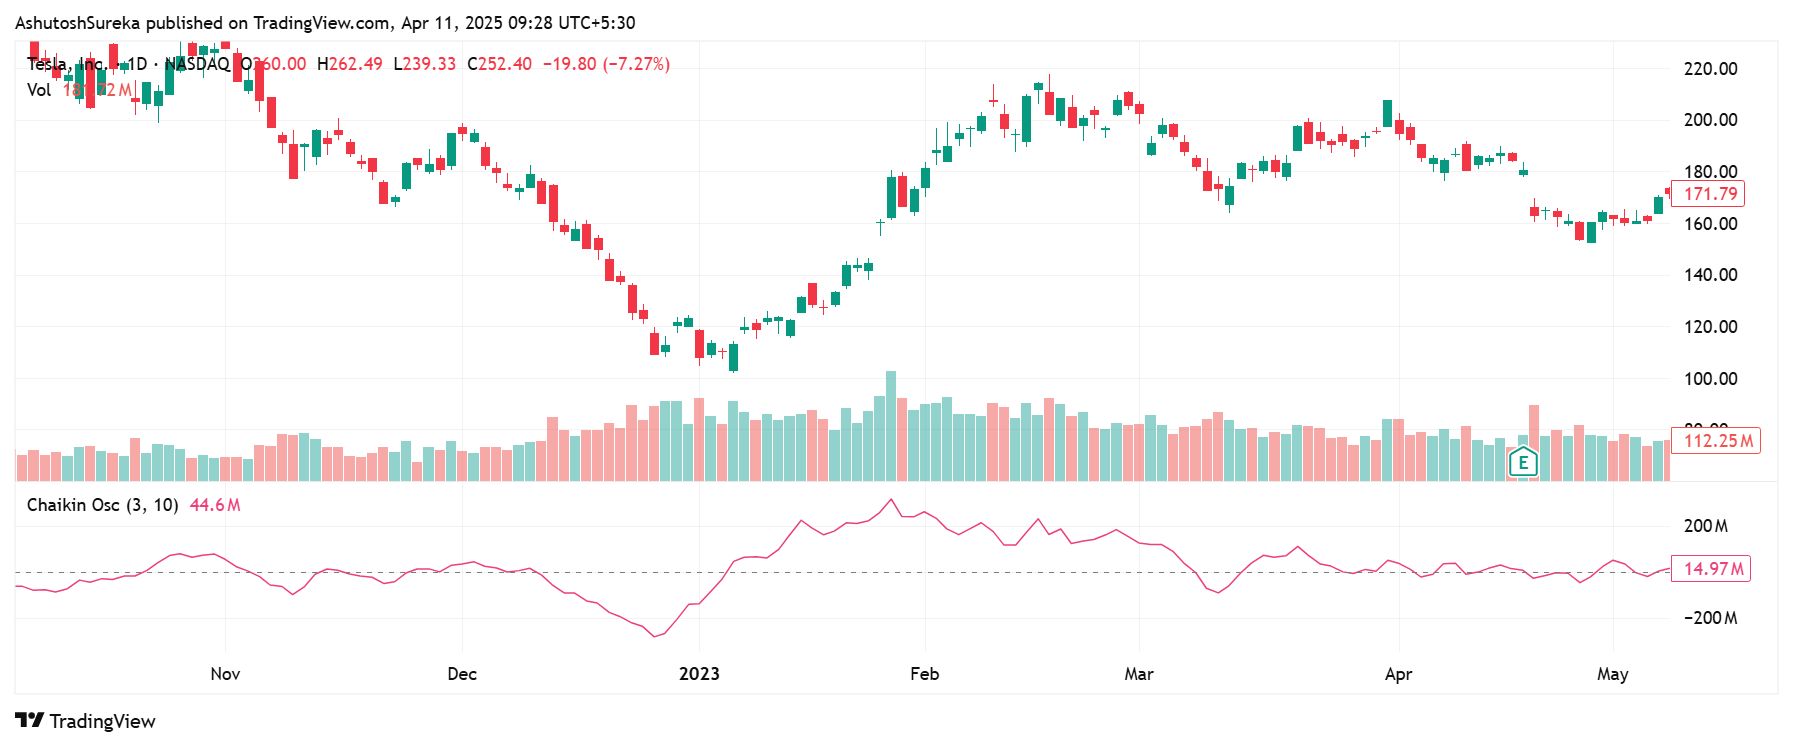
The Chaikin oscillator is a volume-based indicator that helps traders measure buying and selling pressure over time. It works by comparing the short-term and long-term accumulation distribution lines to identify whether money is flowing into or out of an asset. When used correctly, it can help spot trend changes early and confirm whether a breakout has real strength behind it.
Unlike simple moving averages or price-only indicators, the Chaikin oscillator adds depth to your analysis by including both price and volume. This makes it useful for confirming price direction, spotting hidden strength or weakness, and staying out of trades with no real momentum. It’s especially popular in stock trading but can also be used in other markets that track volume.
What it shows
Positive values suggest accumulation or buying interest.
Negative values suggest distribution or selling pressure.
Crossovers above or below the zero line often signal a shift in market control.
Can be used with support, resistance, or other indicators for confirmation.
Origin and development of Chaikin oscillator
The Chaikin oscillator was created by Marc Chaikin, a market analyst and former stockbroker known for his work on volume-based indicators. He introduced it as a way to improve the basic accumulation distribution line by adding momentum to volume signals. The result was a faster, more responsive tool that could help traders act sooner and avoid lagging signals.
Why it was created
The original accumulation distribution line was useful but moved slowly.
Chaikin wanted to make a tool that captured shifts in buying or selling pressure earlier.
By comparing two exponential moving averages of the AD line, he created a quicker signal to track momentum.
How it evolved
First shared in the 1980s through Chaikin’s research and trading platforms.
Later became a built-in feature in major charting tools like MetaTrader, TradingView, and Thinkorswim.
Has become a go-to for traders who want volume and momentum combined into a single signal.
Why it still matters
Helps spot real buying or selling behind price moves.
Gives early warnings of trend reversals or trend confirmation.
Easy to use and read, especially when paired with other price-based indicators.
Understanding the components of Chaikin oscillator
The Chaikin oscillator is made up of a few simple but powerful parts. To use it effectively, you need to understand how each component works together to form the final indicator.
Key elements of the Chaikin oscillator
The oscillator builds on the accumulation distribution (AD) line and applies moving averages to it, creating a momentum signal based on volume.
1. Accumulation distribution (AD) line
This is the foundation of the Chaikin oscillator.
It measures the flow of money into or out of a security.
It is calculated using price and volume data to determine buying or selling pressure over time.
How it works
If a stock closes near its high for the day on high volume, the AD line rises.
If it closes near the low on high volume, the AD line falls.
The AD line gives a cumulative view of whether buyers or sellers are in control.
2. Exponential moving averages (EMAs)
The Chaikin oscillator applies two EMAs to the AD line.
A 3-period EMA (fast) and a 10-period EMA (slow) are used.
The oscillator is the difference between these two EMAs.
What it tells you
When the fast EMA is above the slow EMA, it shows rising buying pressure.
When the fast EMA falls below the slow EMA, it shows growing selling pressure.
The result is a momentum-style line that fluctuates above and below zero.
How the pieces come together
The AD line reflects long-term accumulation or distribution.
The two EMAs track short-term changes in that pressure.
The difference between these two EMAs forms the Chaikin oscillator, which helps you catch shifts in trend strength early.
Reading the signal
A move above zero signals a potential bullish trend.
A move below zero can point to bearish momentum.
The steeper the slope of the oscillator, the stronger the underlying pressure.
How to set up Chaikin oscillator
Setting up the Chaikin oscillator is simple on most platforms. Once it’s added to your chart, you can either stick with the default settings or make small adjustments to suit your style. It works best when paired with clean charts and basic price action levels like support and resistance.
Access the indicator
Adding the Chaikin oscillator to your chart is fast and straightforward.
How to do it
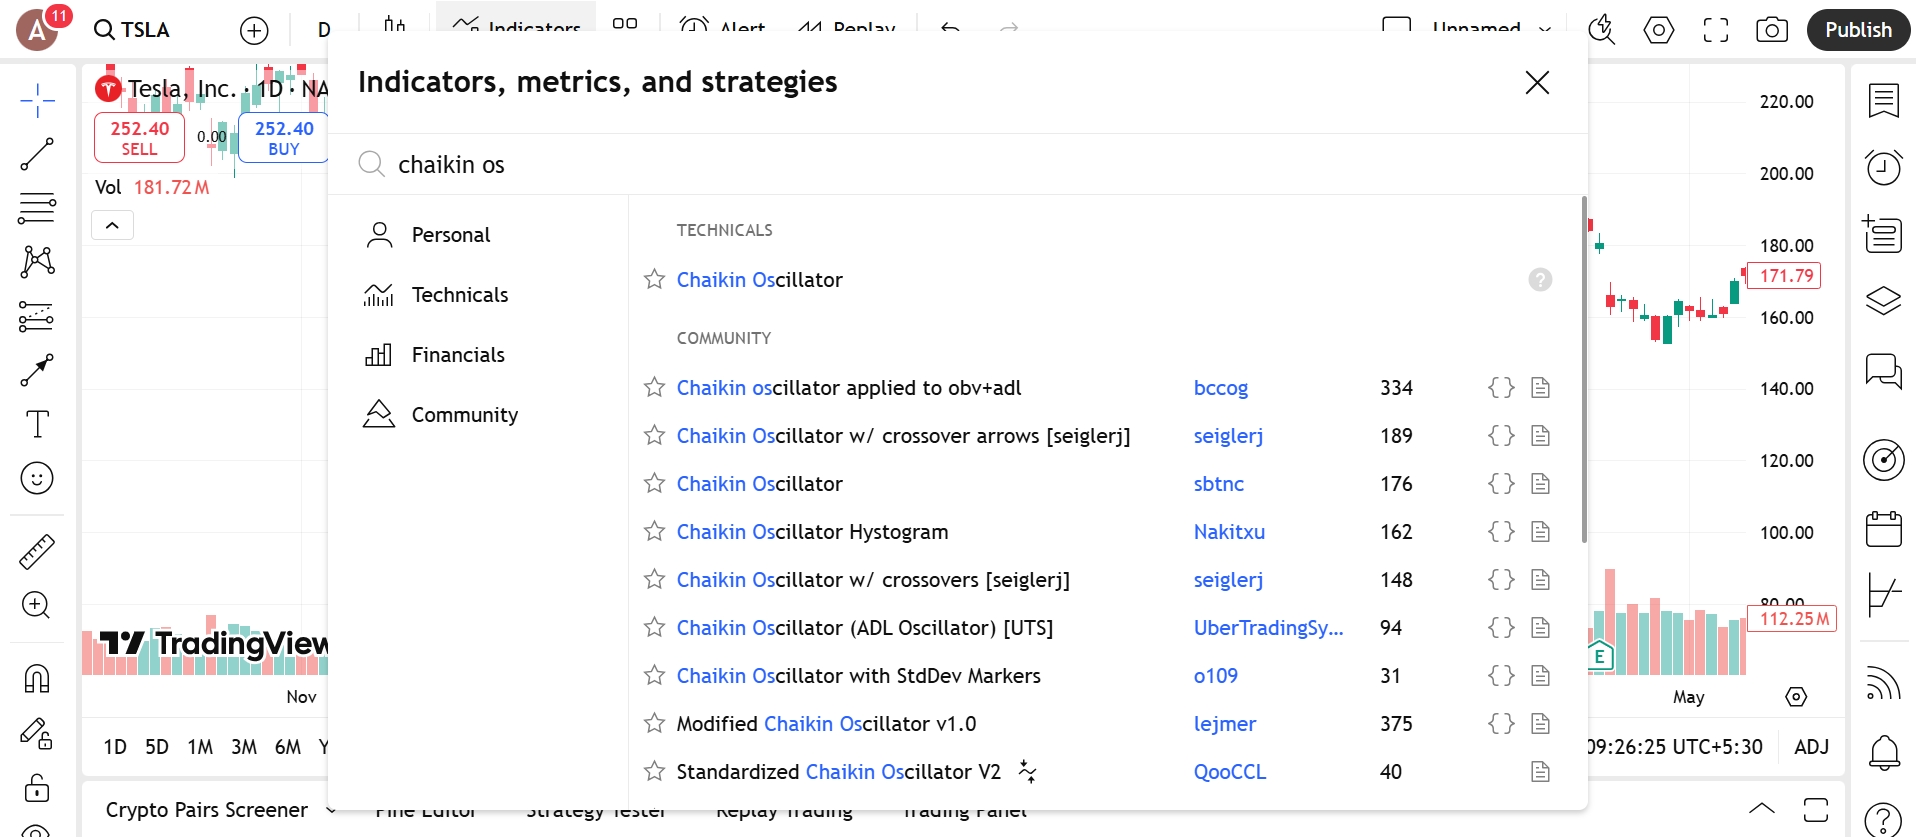
Open the indicators menu in your charting platform.
Type Chaikin Oscillator in the search bar.
Click to apply it. The line will appear below your main chart in a separate pane.
Where it’s available
Pre-installed on TradingView, MetaTrader 4 and 5, ThinkorSwim, and most other charting tools.
No external downloads or plug-ins are required.
Configure the parameters
The Chaikin oscillator has just a few adjustable settings, and the default values usually work well for most traders.
Parameters you can modify
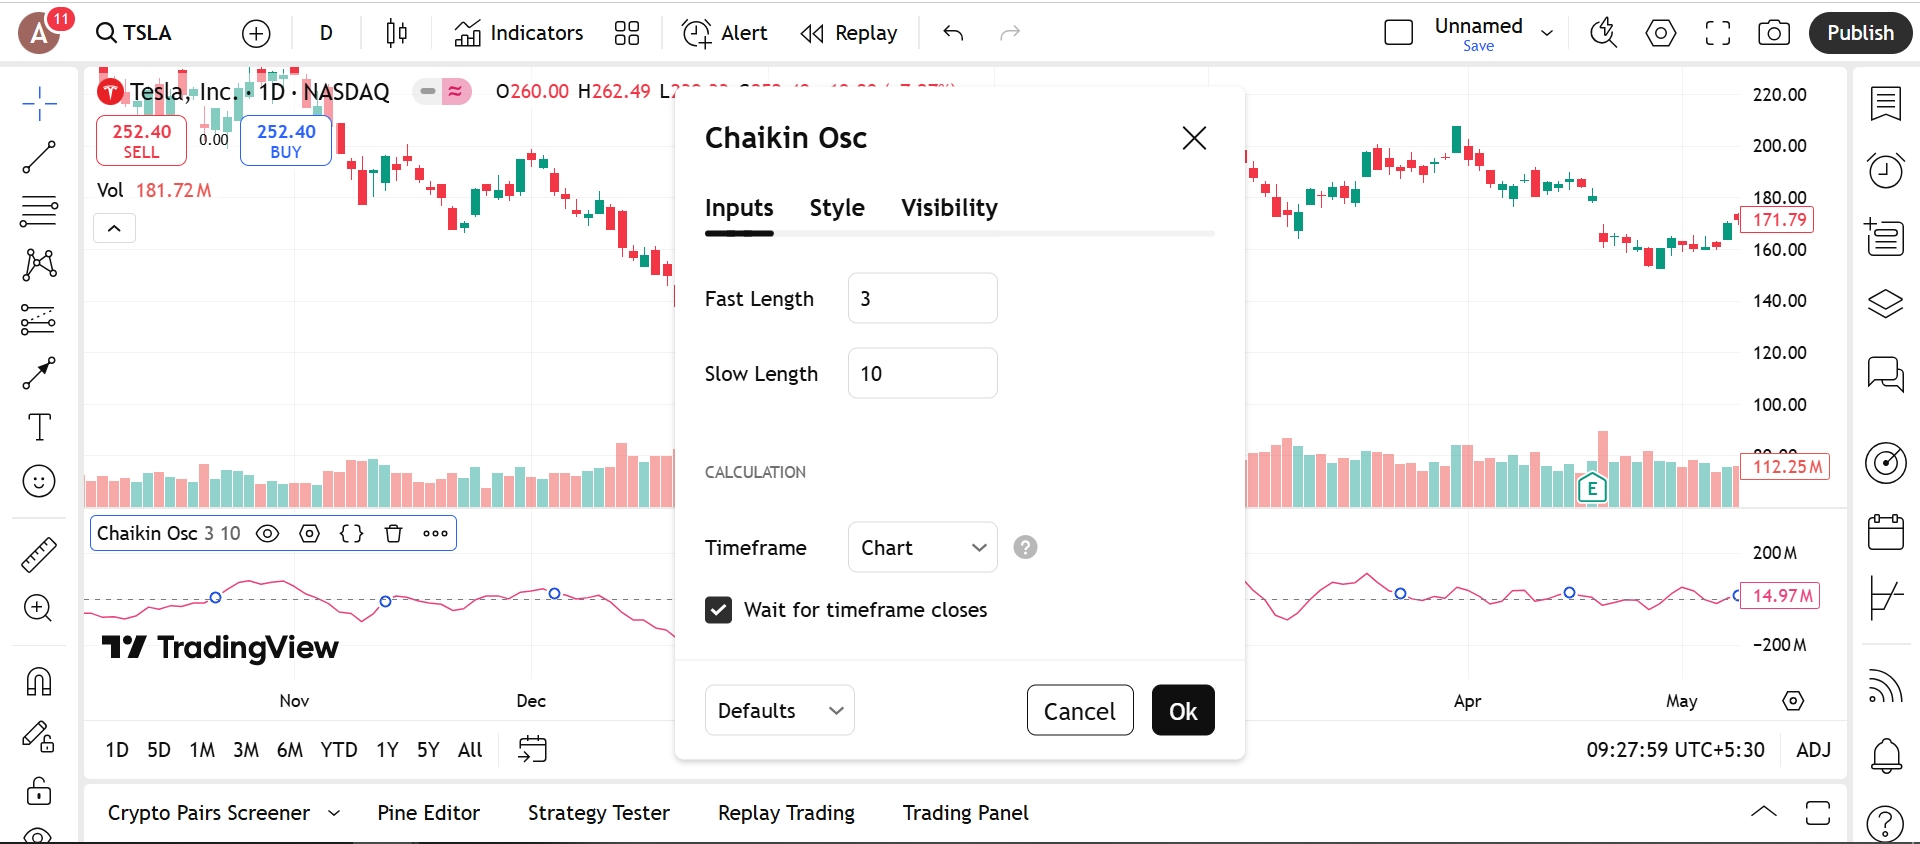
Fast EMA period
Default is 3.
Lower values make the line more responsive but can increase noise.
Slow EMA period
Default is 10.
Higher values smooth the signal but respond slower.
Visual adjustments
Line color and thickness
Change to match your chart theme or make it more visible.Zero line
Some platforms let you highlight the zero line for quicker signal reading.
Tips for a clean setup
Use default values first, then adjust based on your trading timeframe.
Pair the oscillator with support and resistance or trendlines.
Use alerts if your platform allows, especially for zero-line crossovers.
Trading strategies using Chaikin oscillator
Zero line crossover strategy
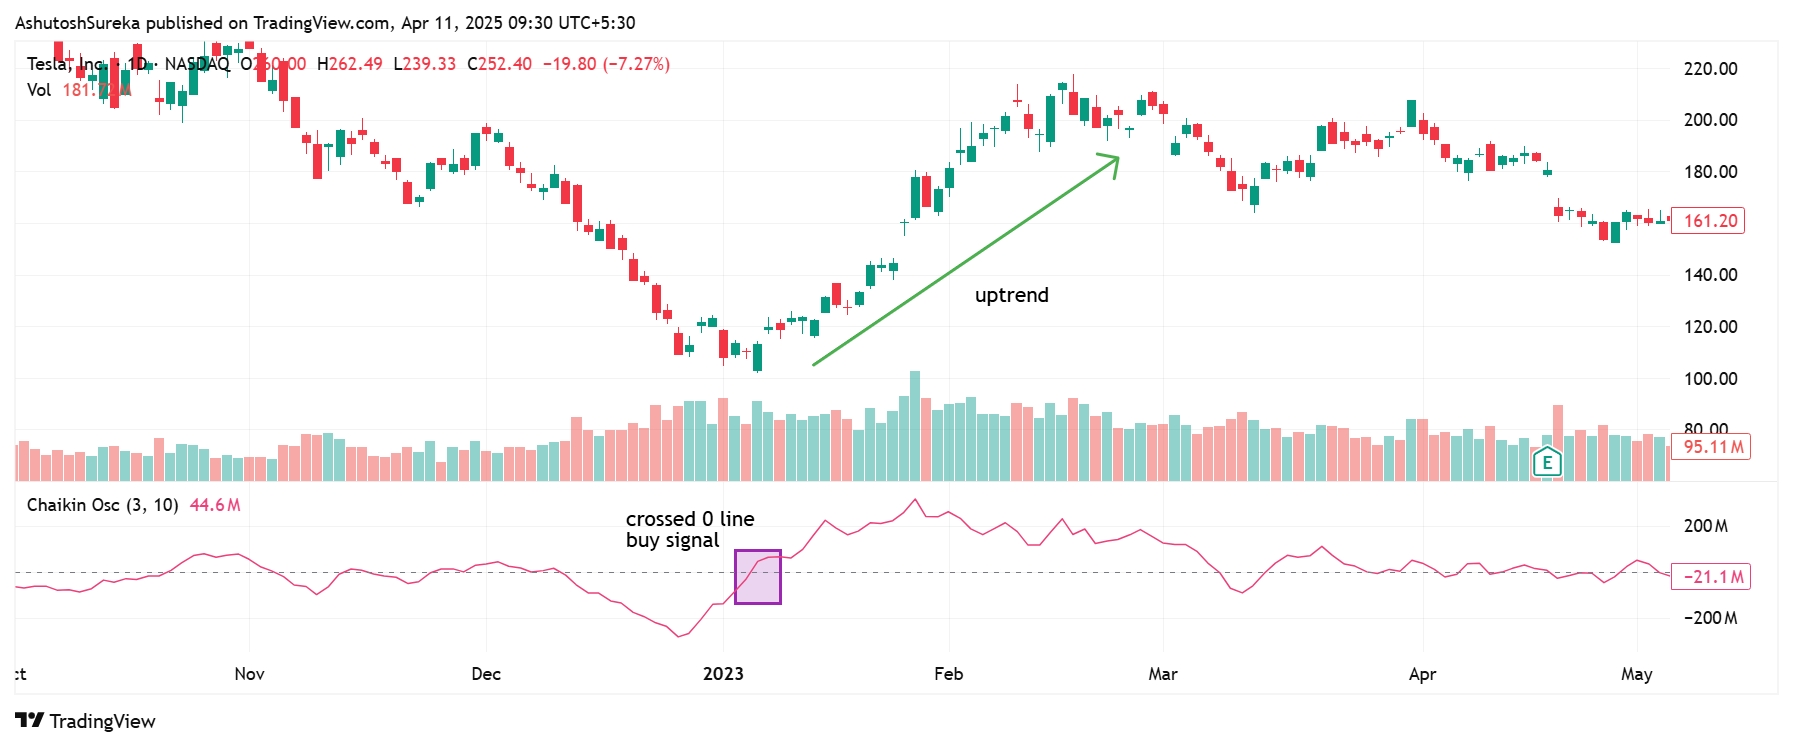
This is the most common and straightforward way to use the Chaikin oscillator: when the line crosses above or below zero, it suggests a shift in market momentum.
How to apply it
Watch for the oscillator to cross above zero as a possible buy signal.
Watch for it to cross below zero as a possible sell signal.
Confirm the move with trendlines, recent highs or lows, or price breakouts.
Exit when the oscillator flattens or crosses in the opposite direction.
Why this helps
Simple signal to follow.
Helps you trade with momentum.
Avoids flat or directionless conditions.
Divergence strategy
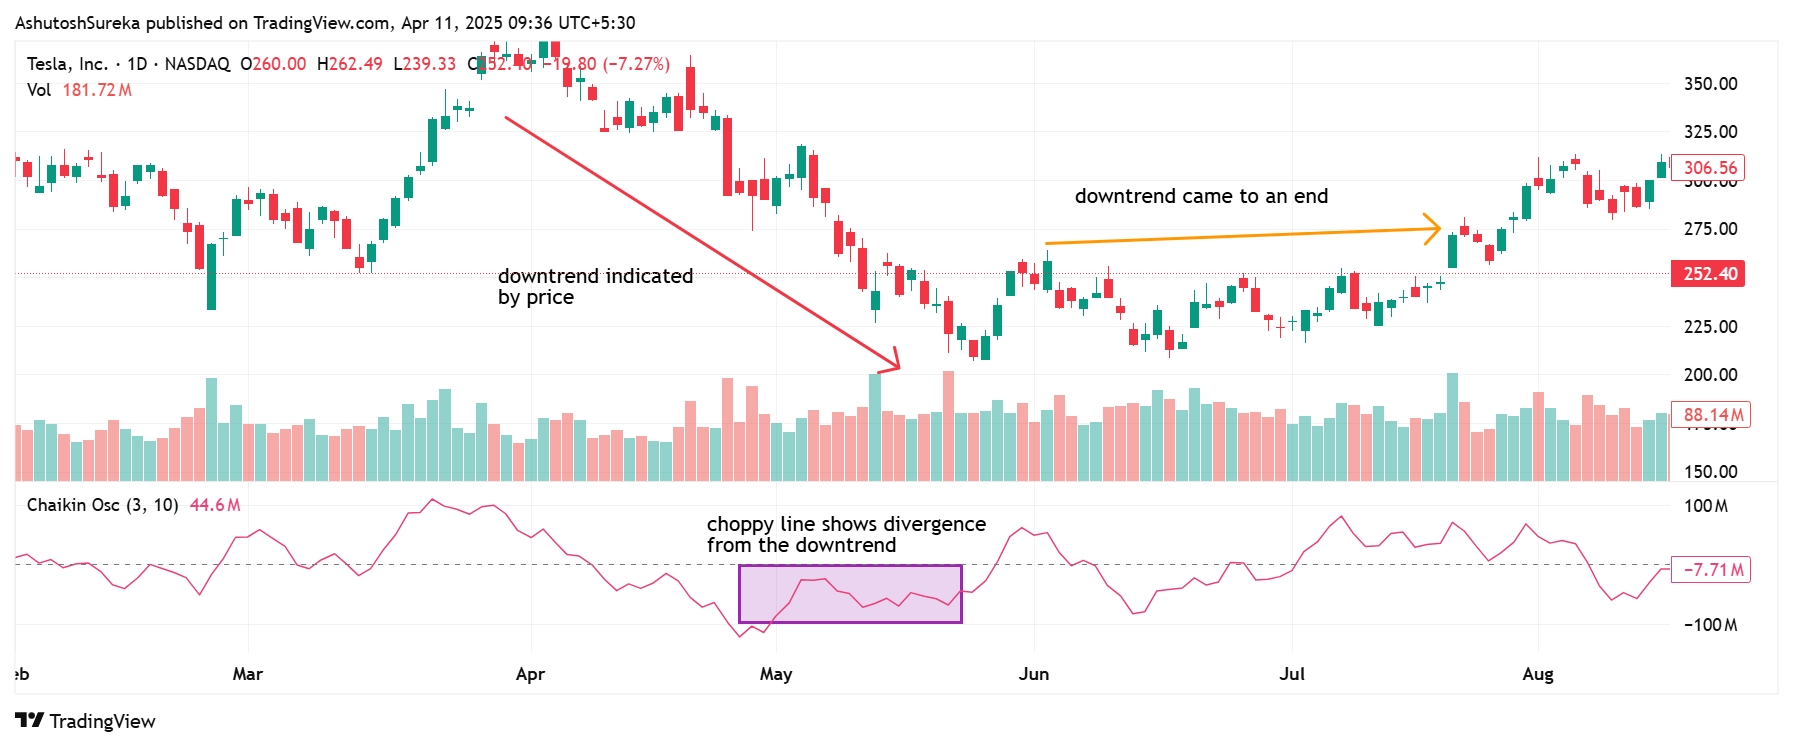
You can use divergence between price and the Chaikin oscillator to spot early signs of a reversal before it becomes obvious on the chart.
How to apply it
If price makes a new high but the oscillator makes a lower high, that’s bearish divergence.
If price makes a new low but the oscillator makes a higher low, that’s bullish divergence.
Look for confirmation with candlestick patterns or support and resistance zones.
Use this as a reversal signal or to tighten stops on existing trades.
Why this helps
Finds early signs of weakness in trends.
Great for spotting exits or new trade setups.
Works especially well after strong trends or sharp moves.
Trend strength filter strategy
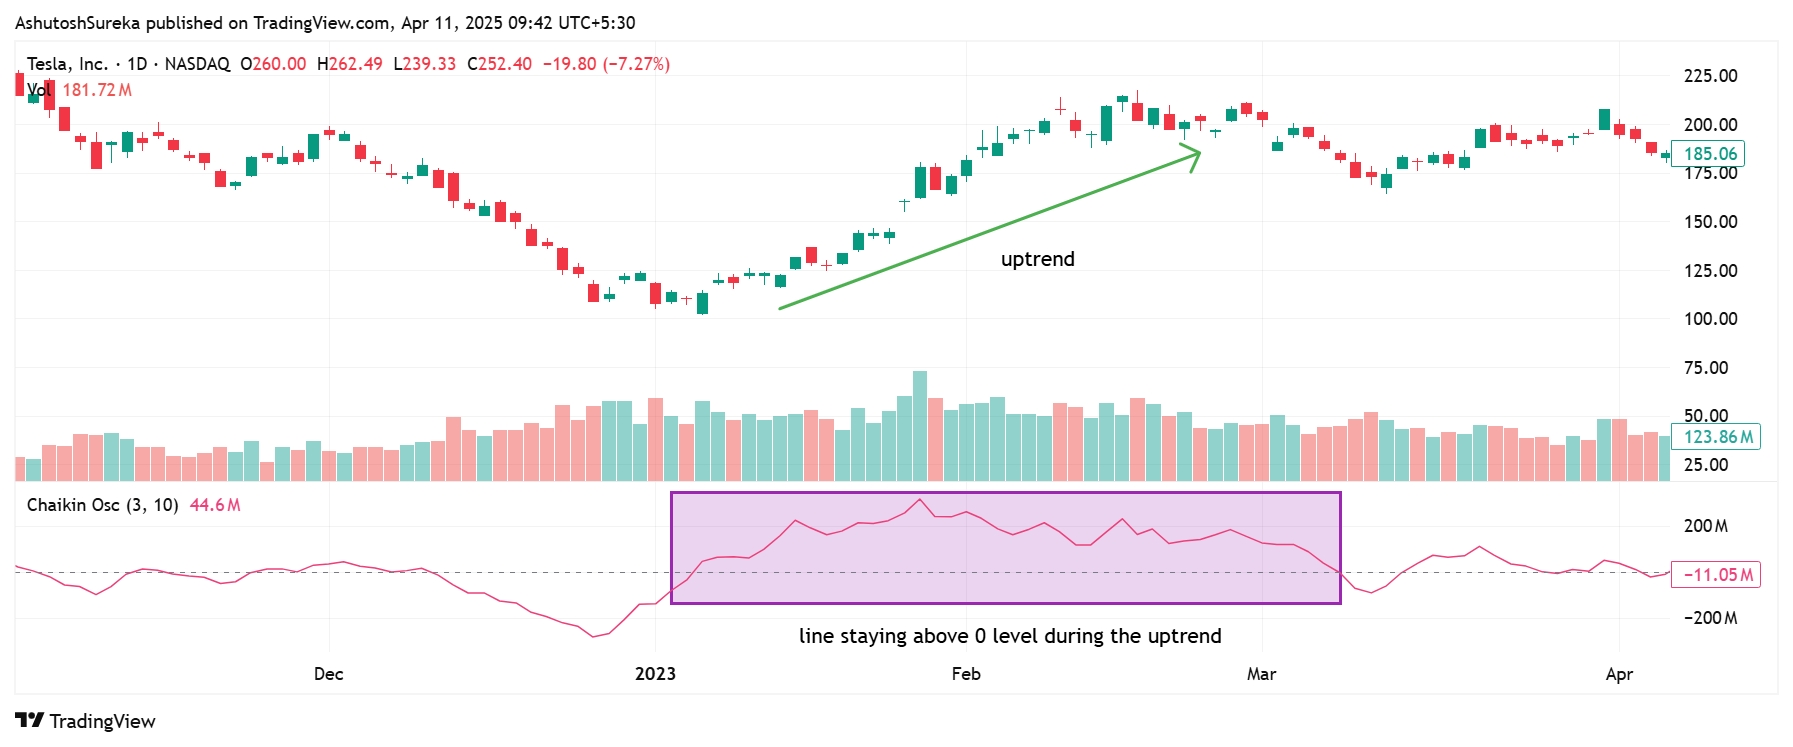
Use the oscillator as a filter to stay in strong trades or avoid weak setups.
How to apply it
In an uptrend, only take long trades when the oscillator is above zero.
In a downtrend, only take short trades when it is below zero.
Skip trades if the oscillator is flat or close to zero.
Why this helps
Keeps you on the right side of market pressure.
Reduces the number of weak or sideways setups.
Makes your trading more focused and selective.
If technical analysis is at the core of your trading strategy, partnering with a broker that supports TradingView, MetaTrader 5 (MT5), or cTrader can be a game-changer. These industry-leading platforms offer powerful charting capabilities, a vast library of technical indicators, and flexible customization options — enabling you to implement even the most complex strategies with ease.
Below, we've compiled a selection of top brokers that provide seamless access to these platforms. Compare their features side by side to find the one that aligns best with your trading goals:
| Currency pairs | Crypto | Stocks | Min. deposit, $ | Max. leverage | TradingView | MT5 | cTrader | Regulation | TU overall score | Open an account | |
|---|---|---|---|---|---|---|---|---|---|---|---|
| 90 | Yes | Yes | No | 1:500 | Yes | Yes | Yes | ASIC, FCA, DFSA, BaFin, CMA, SCB, CySec | 7.17 | Open an account Your capital is at risk.
|
|
| 52 | Yes | Yes | 25 | 1:1000 | No | Yes | Yes | MISA, FSC (Mauritius) | 8.2 | Open an account Your capital is at risk. |
|
| 70 | Yes | Yes | 100 | 1:500 | No | Yes | Yes | FCA, CYSEC, FSCA, SCB, FSA (Seychelles) | 7.9 | Open an account Your capital is at risk. |
|
| 56 | Yes | Yes | 50 | 1:1000 | No | Yes | Yes | CySEC, FSC (Mauritius), SVG FSA | 7.87 | Open an account Your capital is at risk. |
|
| 61 | Yes | Yes | 200 | 1:500 | Yes | Yes | Yes | ASIC, CySEC, and FSA | 7.46 | Open an account Your capital is at risk. |
Why trust us
We at Traders Union have analyzed financial markets for over 14 years, evaluating brokers based on 250+ transparent criteria, including security, regulation, and trading conditions. Our expert team of over 50 professionals regularly updates a Watch List of 500+ brokers to provide users with data-driven insights. While our research is based on objective data, we encourage users to perform independent due diligence and consult official regulatory sources before making any financial decisions.
Learn more about our methodology and editorial policies.
Pros and cons of Chaikin oscillator
- Pros
- Cons
- It combines price action with volume strength. Unlike most momentum tools, the Chaikin oscillator factors in volume to show whether buying or selling pressure is truly building behind a move.
- It’s great for breakout confirmation. If price breaks a key level but the oscillator doesn’t follow, it’s a warning. When both move together, it adds confidence to the setup.
- It helps you spot pressure shifts early. Divergences between the oscillator and price often show up before the chart reacts, giving you time to prepare for reversals or pauses.
- It’s simple and versatile. The zero line offers clear cues for momentum shifts, and the oscillator works just as well on short-term charts as it does for longer-term strategies.
- It depends on real volume data to work well. In markets like Forex where volume isn’t truly tracked, the Chaikin oscillator may give weaker or misleading signals.
- It can get noisy in sideways markets. When price is choppy, the oscillator often hovers near the zero line, which can trigger false signals if you’re not careful.
- It lags during fast, event-driven moves. Sudden breakouts or news spikes can move price before the oscillator has time to react, making it less helpful in high-volatility moments.
- It works best with chart confirmation. For stronger setups, pair it with support, resistance, or trendlines to confirm what the indicator is showing.
Where Chaikin spikes matter more than when it spikes

A mistake most beginners make with the Chaikin Oscillator is waiting for a clear crossover before acting. But the real signal is not when the line crosses. It is where it happens and what the context looks like. If the oscillator crosses up from below zero right after a pullback to support, that is pressure building at the right place.
Same signal in the middle of a choppy range? Probably noise. The strength of the Chaikin Oscillator is in confirming setups not triggering them. You want to see the spike line up with something real — structure, momentum shift, or failed retest. That is when it means something.
Another powerful way to use the Chaikin Oscillator is to track how it behaves during failed breakouts. Let price punch through a resistance level but keep your eye on the oscillator. If it does not spike with the move or rolls over fast, that breakout is likely weak. This gives you an early chance to fade the move before the chart even confirms the failure. It is not about using Chaikin as a go button. It is about using it as a truth meter. If the oscillator and price do not move together, someone is bluffing, and it is usually the candles.
Conclusion
The Chaikin Oscillator is not meant to give you a green light to trade. It is there to show you whether the move is supported by actual buying or just drifting with no real push. If you wait around for clear textbook signals, you will miss the stuff that actually counts. The real value comes when price and volume stop matching. That is where good trades usually show up. Use Chaikin to sort through setups not to pull the trigger. When the reading supports your idea but the chart still looks unsure, that is where most people miss it, and where you can step in early.
FAQs
How is the Chaikin oscillator different from CMF?
The Chaikin oscillator measures the momentum of the Accumulation Distribution Line using two EMAs, while the Chaikin Money Flow (CMF) averages volume flow over a set period. The oscillator reacts faster and highlights short-term shifts more clearly.
Can the Chaikin oscillator be used in Forex trading?
Yes, the Chaikin oscillator can be used in Forex trading, but since Forex lacks real volume data, it relies on tick volume. It still provides insights into buying and selling pressure in currency pairs.
Should I combine the Chaikin oscillator with other indicators?
Yes, combining it with trend or momentum indicators like MACD, RSI, or moving averages helps filter false signals and confirm trade setups, especially in volatile or uncertain markets.
Can you use the Chaikin oscillator for short term trading?
Yes, the Chaikin oscillator is suitable for short term trading as it helps spot momentum changes and potential reversals. It works well on lower time frames when supported by confirmation tools.
Related Articles
Team that worked on the article
Mikhail Vnuchkov joined Traders Union as an author in 2020. He began his professional career as a journalist-observer at a small online financial publication, where he covered global economic events and discussed their impact on the segment of financial investment, including investor income. With five years of experience in finance, Mikhail joined Traders Union team, where he is in charge of forming the pool of latest news for traders, who trade stocks, cryptocurrencies, Forex instruments and fixed income.
Chinmay Soni is a financial analyst with more than 5 years of experience in working with stocks, Forex, derivatives, and other assets. As a founder of a boutique research firm and an active researcher, he covers various industries and fields, providing insights backed by statistical data. He is also an educator in the field of finance and technology.
As an author for Traders Union, he contributes his deep analytical insights on various topics, taking into account various aspects.
Mirjan Hipolito is a journalist and news editor at Traders Union. She is an expert crypto writer with five years of experience in the financial markets. Her specialties are daily market news, price predictions, and Initial Coin Offerings (ICO).
An investor is an individual, who invests money in an asset with the expectation that its value would appreciate in the future. The asset can be anything, including a bond, debenture, mutual fund, equity, gold, silver, exchange-traded funds (ETFs), and real-estate property.
Divergence serves as a valuable concept for predicting potential shifts in market direction. It happens when the price movement of a currency pair and a particular technical indicator do not conform, but rather go in opposite directions.
Forex trading, short for foreign exchange trading, is the practice of buying and selling currencies in the global foreign exchange market with the aim of profiting from fluctuations in exchange rates. Traders speculate on whether one currency will rise or fall in value relative to another currency and make trading decisions accordingly. However, beware that trading carries risks, and you can lose your whole capital.
Forex leverage is a tool enabling traders to control larger positions with a relatively small amount of capital, amplifying potential profits and losses based on the chosen leverage ratio.
Volatility refers to the degree of variation or fluctuation in the price or value of a financial asset, such as stocks, bonds, or cryptocurrencies, over a period of time. Higher volatility indicates that an asset's price is experiencing more significant and rapid price swings, while lower volatility suggests relatively stable and gradual price movements.


-
 Afghanistan
-
 Albania
-
 Algeria
-
 Argentina
-
 Armenia
-
 Australia
-
 Austria
-
 Azerbaijan
-
 Bahamas
-
 Bahrain
-
 Bangladesh
-
 Belgium
-
 Botswana
-
 Brazil
-
 Brunei
-
 Bulgaria
-
 Burma
Burma
-
 Cambodia
-
 Cameroon
-
 Canada
-
 Chile
Chile
-
 China
China
-
 Colombia
-
 Costa Rica
-
 Cote d'Ivoire
-
 Croatia
-
 Cyprus
-
 Czech Republic
-
 Denmark
-
 Dominican Republic
-
 Ecuador
-
 Egypt
Egypt
-
 Estonia
-
 Eswatini
-
 Ethiopia
-
 Finland
-
 France
-
 Georgia
-
 Germany
-
 Ghana
Ghana
-
 Greece
-
 Haiti
Haiti
-
 Hong Kong
-
 Hungary
-
 India
India
-
 Indonesia
-
 Iran, Islamic republic
-
 Iraq
Iraq
-
 Ireland
-
 Israel
-
 Italy
Italy
-
 Jamaica
-
 Japan
Japan
-
 Jordan
-
 Kazakhstan
-
 Kenya
Kenya
-
 Korea
Korea
-
 Kuwait
-
 Kyrgyzstan
-
 Laos
Laos
-
 Latvia
-
 Lebanon
-
 Libyan Arab Jamahiriya
-
 Lithuania
-
 Luxembourg
-
 Macedonia
-
 Madagascar
-
 Malaysia
-
 Malta
Malta
-
 Mauritius
-
 Mexico
-
 Moldova
-
 Mongolia
-
 Montenegro
-
 Morocco
-
 Mozambique
-
 Namibia
-
 Nepal
Nepal
-
 Netherlands
-
 Nigeria
-
 Norway
-
 Oman
Oman
-
 Pakistan
-
 Palestine
-
 Papua New Guinea
-
 Peru
Peru
-
 Philippines
-
 Poland
-
 Portugal
-
 Puerto Rico
-
 Qatar
Qatar
-
 Romania
-
 Rwanda
-
 Saudi Arabia
-
 Serbia
-
 Singapore
-
 Slovakia
-
 Slovenia
-
 Somalia
-
 South Africa
-
 Spain
Spain
-
 Sri Lanka
-
 Sweden
-
 Switzerland
-
 Syrian Arab Republic
-
 Taiwan
-
 Tajikistan
-
 Tanzania, United Republic Of
-
 Thailand
-
 Trinidad and Tobago
-
 Tunisia
-
 Turkey
-
 UAE
UAE
-
 Uganda
-
 Ukraine
-
 United Kingdom
-
United States
-
 Uzbekistan
-
 Venezuela
-
 Vietnam
-
 Yemen
Yemen
-
 Zambia
-
 Zimbabwe
- Forex
- Crypto
