How To Use Chandelier Exit Indicator For Smarter Trade Management


Editorial Note: While we adhere to strict Editorial Integrity, this post may contain references to products from our partners. Here's an explanation for How We Make Money. None of the data and information on this webpage constitutes investment advice according to our Disclaimer.
The Chandelier Exit is a trailing stop indicator that adjusts based on volatility using the Average True Range. It helps traders stay in strong trends longer by expanding during high volatility and tightening when the market calms, offering smarter, real-time stop-loss placement.
Most traders treat stop losses like a generic rule or a last-minute panic exit. The Chandelier Exit changes that by adjusting based on how wild the market gets. When things heat up it gives your trade more room. When things slow down it keeps you tighter. That small tweak changes how you stick with a trade. It is not about booking profits quickly. It is about staying in the part of the trend that actually pays. If you are still using the same percentage stops on every trade you are flying blind with your risk.
Risk warning: Forex trading carries high risks, with potential losses including your entire deposit. Market fluctuations, economic instability, and geopolitical factors impact outcomes. Studies show that 70-80% of traders lose money. Consult a financial advisor before trading.
Introduction to Chandelier Exit indicator
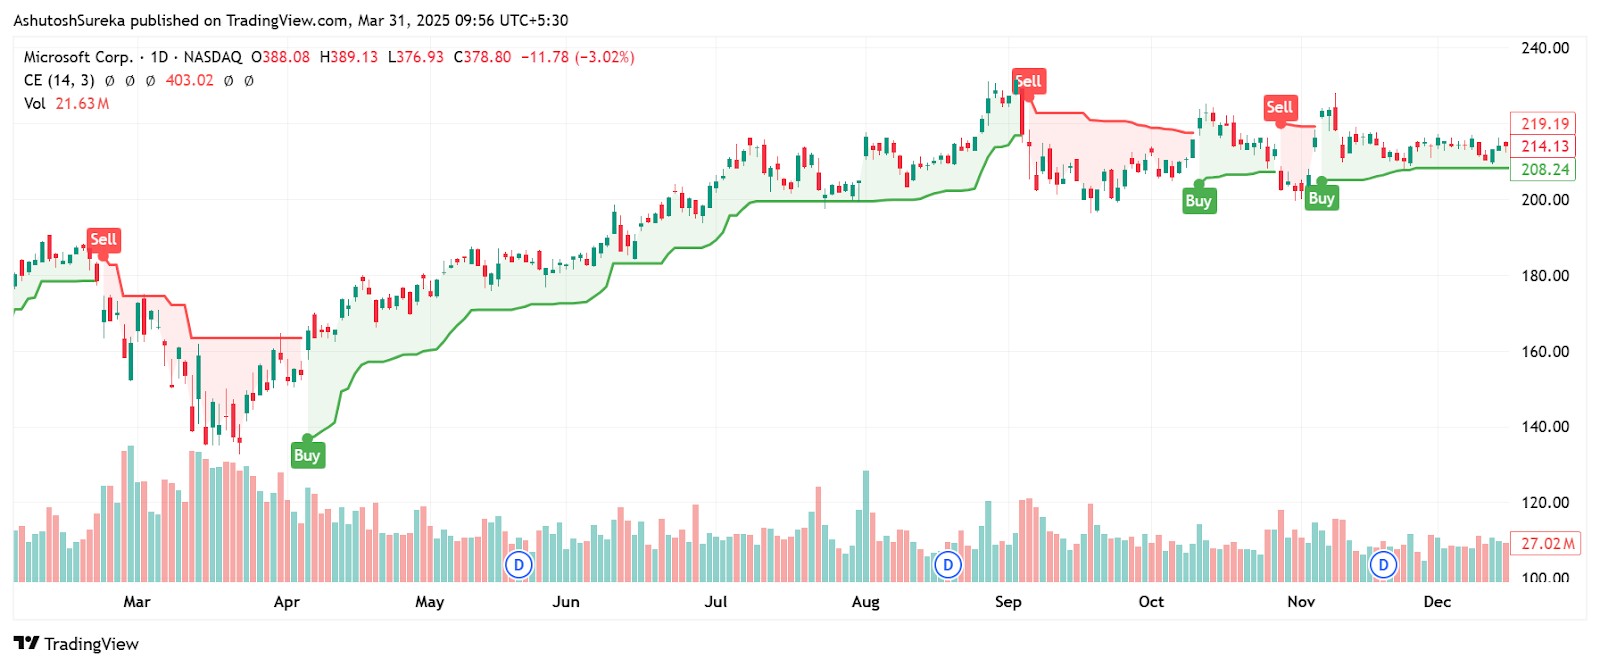
The Chandelier Exit is a volatility-based trailing stop indicator designed to help traders lock in profits while allowing winning trades to run. It works by placing a stop-loss level below (or above) the current price at a distance based on the market’s volatility — typically calculated using the Average True Range (ATR).
What Chandelier Exit is used for
Trailing stop strategy Instead of using a fixed stop-loss, it moves with price — tightening during low volatility and widening in volatile conditions.
Helps manage risk and protect profits The indicator allows traders to stay in a trend while minimizing the risk of getting stopped out too early.
Works well in trending markets It's best suited for trend-following setups, helping traders ride out long moves without exiting prematurely.
How it appears on the chart
For long positions The Chandelier Exit level is plotted below the current price.
For short positions The indicator plots above the current price.
When price touches or closes beyond this level, it may signal an exit or stop trigger.
Origin and development of Chandelier Exit indicator
The Chandelier Exit was developed by Chuck LeBeau, a professional trader and systems developer known for his focus on exit strategies and volatility-based trading tools. He created the indicator to provide a smarter alternative to static stop-losses, especially for traders looking to let profits run during strong trends.
Understanding the components of Chandelier Exit
The Chandelier Exit may look like a simple trailing stop on the chart, but behind the scenes, it’s built on a few smart components that make it responsive to market conditions.
Average True Range (ATR)
The core engine behind the Chandelier Exit is the Average True Range (ATR) — a widely used measure of market volatility.
What ATR does
Measures how much price moves ATR tracks the average range between high and low prices over a set number of periods, typically 14.
Bigger ATR = more volatility If the market is moving aggressively, the ATR value increases.
Smaller ATR = lower volatility During calm or sideways phases, the ATR value contracts.
Why it matters
Helps adapt stop distance A more volatile market needs a wider stop. The ATR ensures that the Chandelier Exit adjusts automatically to avoid premature exits during normal price swings.
ATR multiplier
The Chandelier Exit uses a multiplier of the ATR to determine how far the stop should trail behind (or ahead of) price.
Common settings
3× ATR is the standard This means the stop level is placed 3 times the ATR value away from the high (for longs) or the low (for shorts).
Customizable based on strategy Traders who want tighter stops might use 2.5×, while those looking to give trades more breathing room might go with 3.5× or 4×.
Why it’s useful
Flexibility You can adjust the multiplier to match your risk tolerance and time horizon.
Dynamic response The indicator becomes tighter during calm markets and more forgiving in fast-moving conditions.
Highest high or lowest low
To calculate where the stop should sit, the Chandelier Exit looks at price extremes over a given period.
Long trades
Based on the highest high over the past n periods (usually 22).
The stop-loss is set at: Chandelier Exit = Highest High (n) − (ATR × Multiplier)
Short trades
Based on the lowest low over the same n periods.
The stop-loss is set at: Chandelier Exit = Lowest Low (n) + (ATR × Multiplier)
Why this matters
Keeps the stop close to recent extremes This helps you capture more of the trend without setting your exit point unrealistically tight or wide.
Customizable lookback period
The final part of the formula is the lookback period — the number of candles the indicator uses to find the highest high or lowest low.
Typical setting
22 periods is the default This is a popular choice for swing traders on daily charts.
Adjusting the period
Shorter lookback = tighter stop Reacts more quickly to price changes, but may trigger more frequent exits.
Longer lookback = wider stop Offers more space but might delay your exit during reversals.
How to set up Chandelier Exit
The Chandelier Exit is easy to add to your chart and doesn’t take long to configure. It works as a trailing stop that adjusts based on market volatility, helping you manage risk without needing to constantly update your stop manually.
Access the indicator
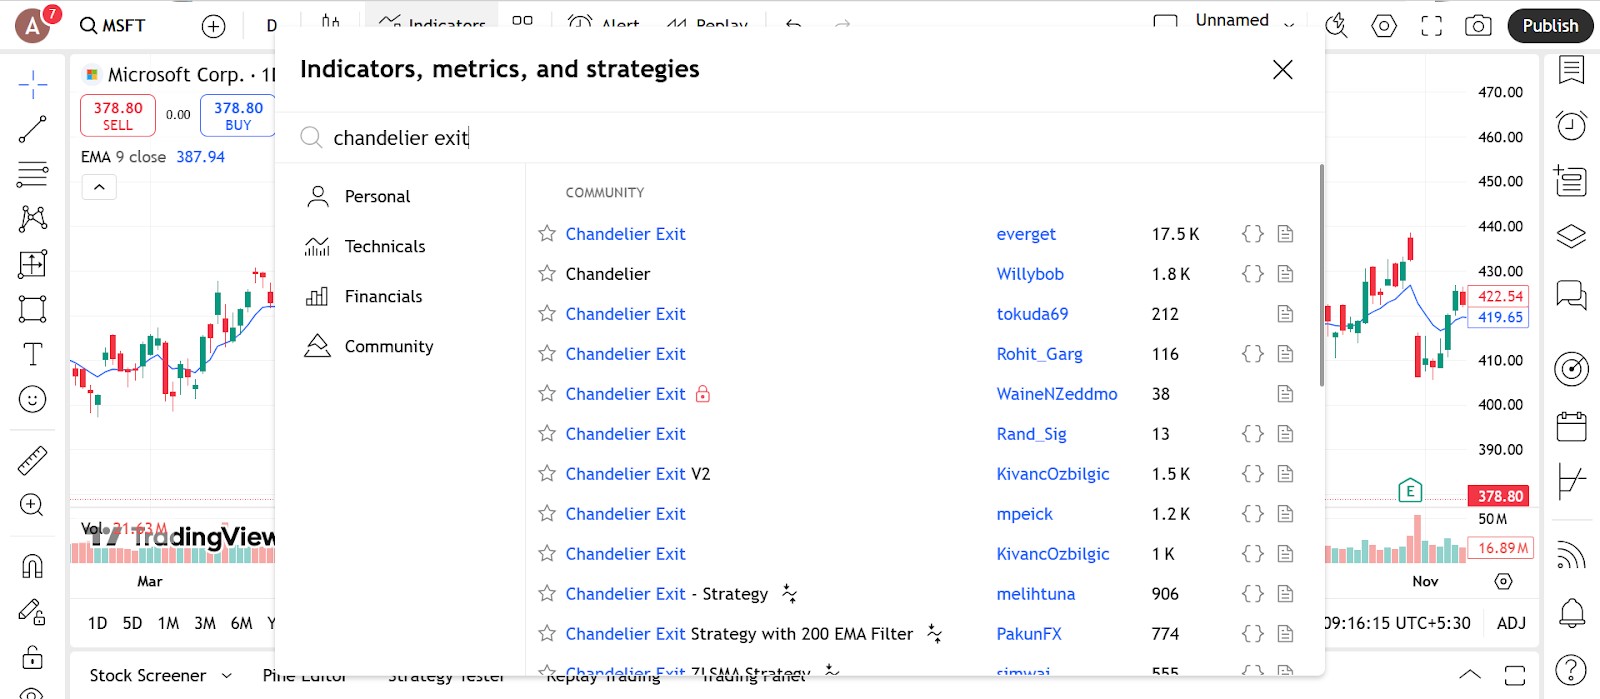
Here’s how to get the Chandelier Exit running on your chart.
Where to find it
Open the indicators menu Type “Chandelier Exit” into the search bar — it’s usually under volatility or trend-based tools.
Works on most platforms Whether you’re using TradingView, MetaTrader, or ThinkorSwim, the indicator should be built-in.
Add it with one click Once added, it’ll show up as a line either trailing below the price for long trades or above for shorts.
Tips for setup
Use it on charts that are trending The Chandelier Exit works best when price is moving clearly in one direction.
Try it on different timeframes It can be just as useful on a 1-hour chart as it is on a daily one — just adjust the settings to match.
Configure the parameters
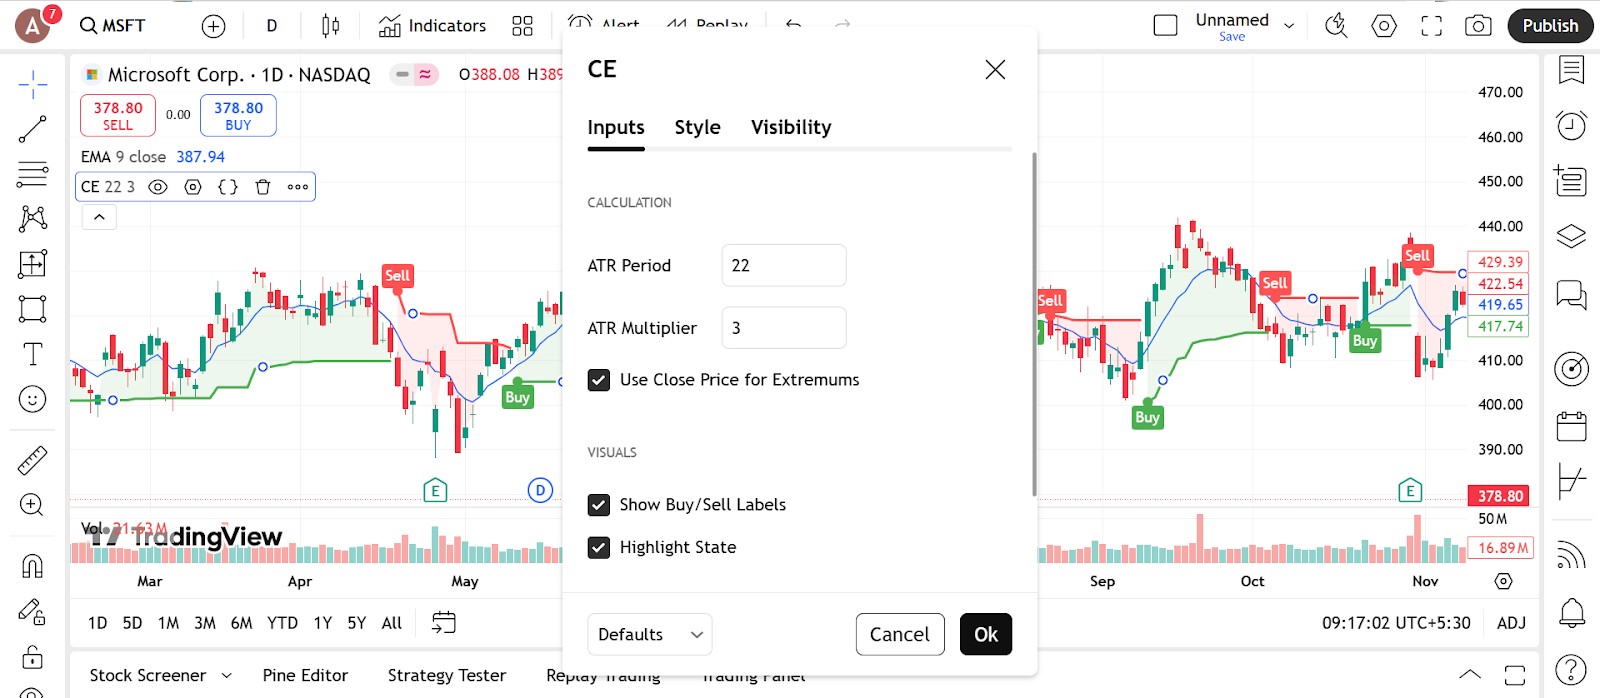
To get the most out of this tool, tweak a few key settings based on your trading style.
ATR period
Default is 14 This tracks how much price typically moves. It adjusts how tight or loose your stop will be.
Lower values = quicker reaction If you want faster stop adjustments, try using a 10-period ATR.
Higher values = smoother stop levels Using 20 or more makes the stop less sensitive to minor moves.
Multiplier
Default is 3 times ATR This means your stop will sit 3 times the average price range away from the high (for longs) or the low (for shorts).
Tighter stops Use 2.5 or even 2 as your multiplier if you want to lock in gains faster.
Wider stops If the market is volatile, using 3.5 or 4 can help avoid getting stopped out too soon.
Lookback period
22 candles is standard This tells the indicator how far back to look for the highest high or lowest low.
Go shorter for quicker exits A 14-period lookback gives you a more active trailing stop.
Go longer for more cushion A 30+ setting keeps the stop further from price — better for longer-term trades.
Visual tweaks
Change the line style Make the line thick and choose a color that stands out from your price chart.
Enable for both directions Some tools let you turn the long or short stops on/off — keep both enabled if you’re trading both sides of the market.
Trading strategies using Chandelier Exit
The Chandelier Exit is a smart way to manage trades while the market is trending. It automatically follows price based on volatility, helping you stay in profitable trades longer and exit at more logical points. Below are practical ways traders use it to ride trends, lock in profits, and avoid emotional decisions.
Following the trend
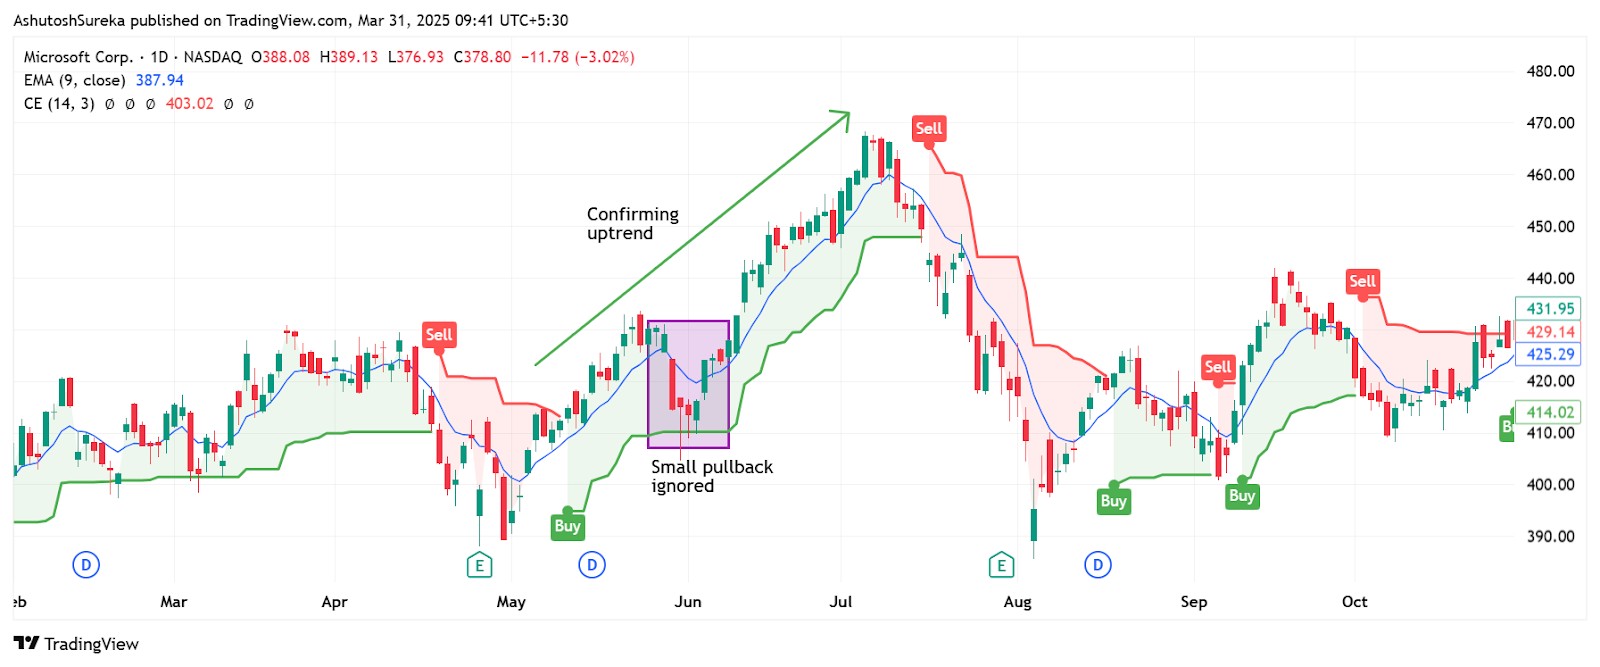
This is where the Chandelier Exit shines — it keeps you in the trade while the trend is strong and pulls you out when momentum fades.
How to apply it
Enter using your usual trend signal such as moving averages or breakouts.
Once in the trade, apply the Chandelier Exit so it begins trailing the price.
Exit when the price touches the line which signals the trend may be losing strength.
Why it works
You avoid jumping out too early on small pullbacks.
The stop adapts to volatility giving the trade space to move while protecting gains.
Managing swing trades
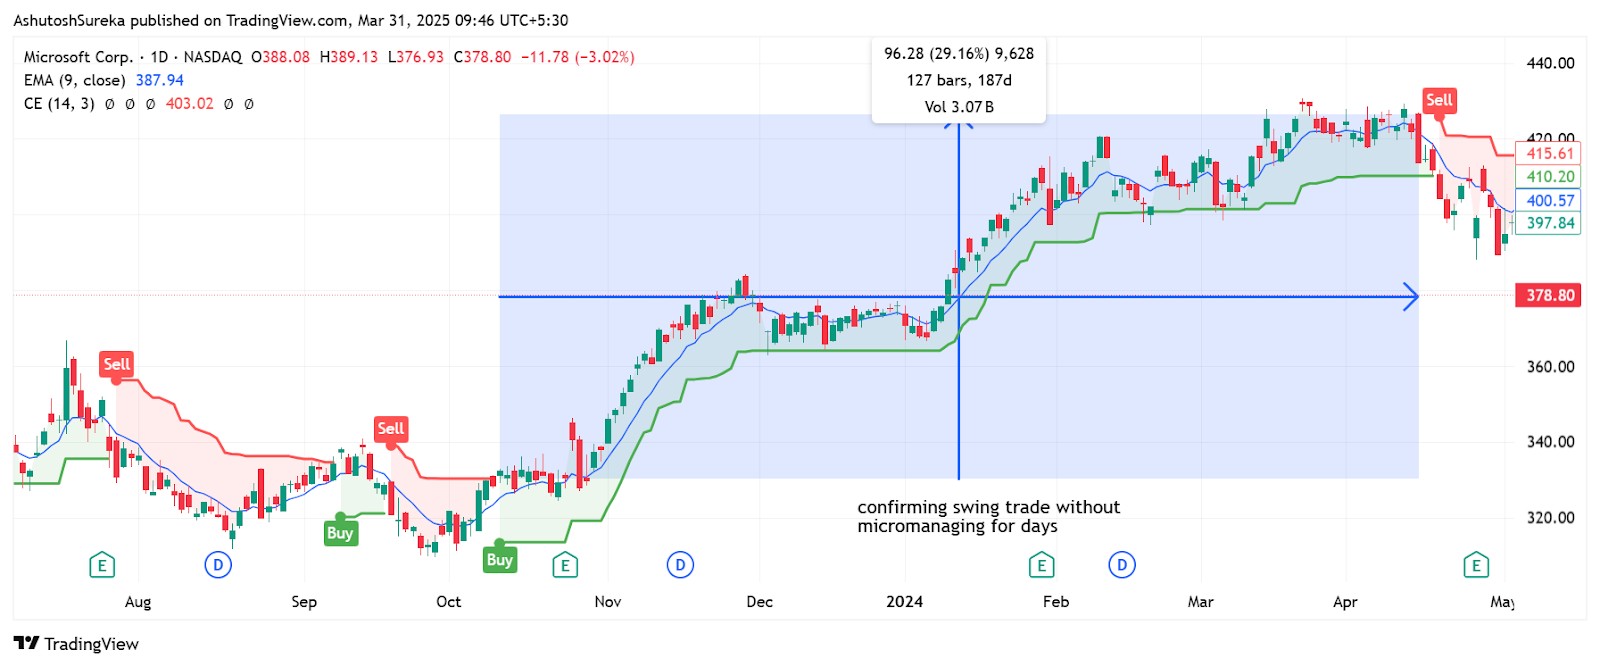
Swing traders use the Chandelier Exit to hold trades over multiple days without micromanaging stop levels.
Strategy steps
Enter after a breakout or during a retracement.
Add the Chandelier Exit immediately so it starts tracking price.
As the trade moves in your favor, the trailing stop adjusts.
Exit only when the price breaks the trailing line.
Helpful tips
Use a 3 times ATR setting and a 22 period lookback for balanced movement.
Tighten the multiplier to 2.5 once your trade has moved deep into profit.
Using it with other indicators
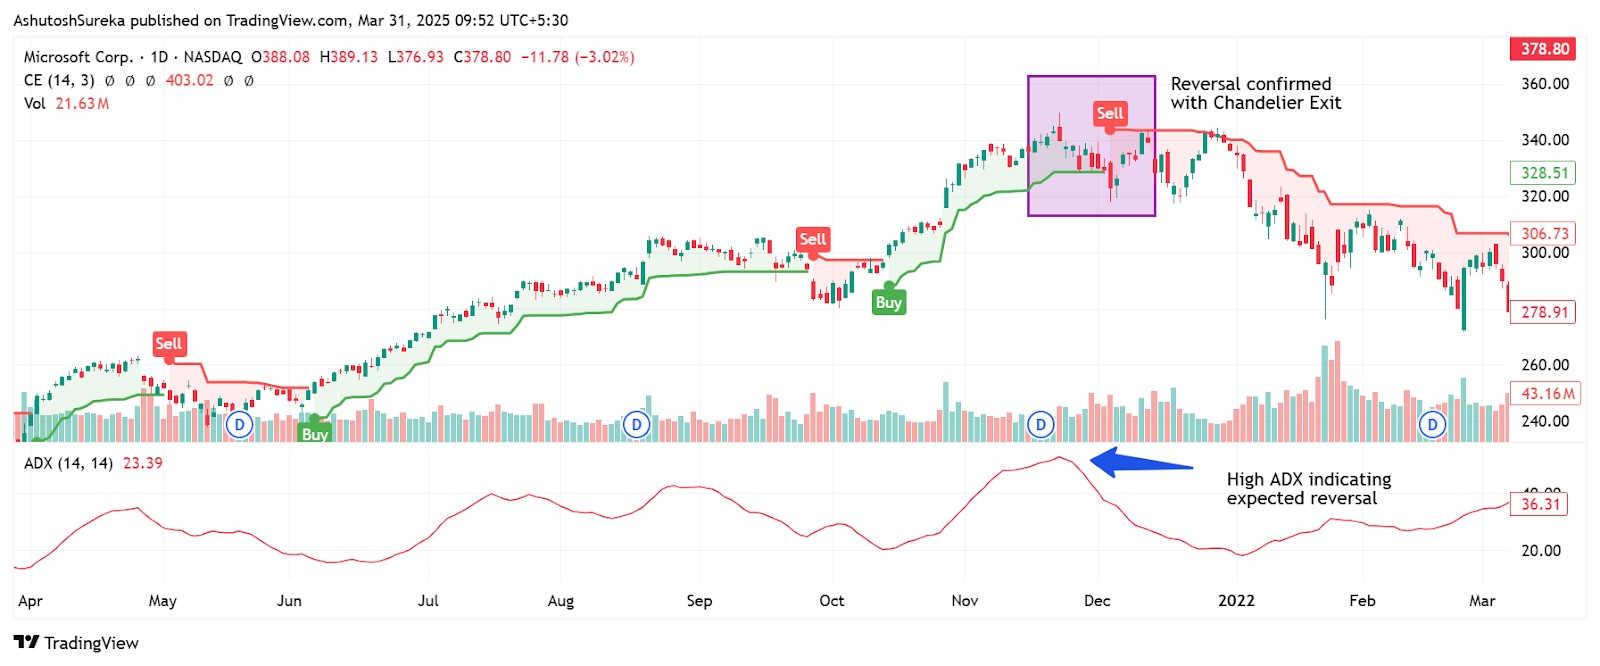
Although it is primarily used to manage exits, the Chandelier Exit can also give you hints about market direction when paired with other indicators.
How to integrate it
Confirm the trend using ADX, moving averages, or support resistance.
Use the Chandelier Exit to spot recent exit points from previous trades.
If the price has crossed back above or below the Chandelier line, it may signal a new move is forming.
If your trading strategy requires the use of many technical indicators, using a broker that supports TradingView, MT5, or cTrader can make your life easier. These tools provide access to a wide range of technical tools, covering almost all the strategies you can think of. In the table below, we have presented the top brokers with access to the abovementioned platforms. You can compare them and choose the best one for yourself:
| Currency pairs | Crypto | Stocks | Min. deposit, $ | Max. leverage | TradingView | MT5 | cTrader | Regulation | TU overall score | Open an account | |
|---|---|---|---|---|---|---|---|---|---|---|---|
| 60 | Yes | Yes | 100 | 1:300 | Yes | No | No | FCA, CySEC, MAS, ASIC, FMA, FSA (Seychelles) | 6.83 | Open an account Your capital is at risk. |
|
| 90 | Yes | Yes | No | 1:500 | Yes | Yes | Yes | ASIC, FCA, DFSA, BaFin, CMA, SCB, CySec | 7.17 | Open an account Your capital is at risk.
|
|
| 68 | Yes | Yes | No | 1:200 | Yes | Yes | No | FSC (BVI), ASIC, IIROC, FCA, CFTC, NFA | 6.8 | Open an account Your capital is at risk. |
|
| 80 | Yes | Yes | 100 | 1:50 | Yes | Yes | No | CIMA, FCA, FSA (Japan), NFA, IIROC, ASIC, CFTC | 6.95 | Study review | |
| 100 | Yes | Yes | No | 1:30 | Yes | No | No | SEC, FINRA, SIPC, FCA, NSE, BSE, SEBI, SEHK, HKFE, IIROC, ASIC, CFTC, NFA | 6.9 | Open an account Your capital is at risk. |
Why trust us
We at Traders Union have analyzed financial markets for over 14 years, evaluating brokers based on 250+ transparent criteria, including security, regulation, and trading conditions. Our expert team of over 50 professionals regularly updates a Watch List of 500+ brokers to provide users with data-driven insights. While our research is based on objective data, we encourage users to perform independent due diligence and consult official regulatory sources before making any financial decisions.
Learn more about our methodology and editorial policies.
Advantages and limitations of Chandelier Exit
The Chandelier Exit stands out as a flexible exit tool that adjusts with market conditions. It is especially popular among trend-following and swing traders who want a simple, rule-based way to trail their stops. Still, like any indicator, it has strengths and weaknesses that you need to understand to use it effectively.
Advantages of Chandelier Exit
The indicator is widely respected for its ability to protect profits while staying aligned with market volatility.
It adapts to market conditions
Uses ATR to respond to how volatile the market is.
Expands during wide price swings and tightens when the market calms down.
Helps avoid being stopped out by random intraday noise.
Keeps traders in winning trades longer
The trailing stop moves with the trend rather than sitting still.
Prevents emotional exits and avoids cutting trades short too early.
Lets you ride the trend until price actually signals weakness.
Simple and easy to apply
No need to manually adjust stops after every candle.
Works well with most charting platforms and is quick to set up.
Visual representation makes it easy to spot when to exit.
Helps automate exit plans
Removes second guessing from trade management.
Can be used as part of a mechanical or rule-based system.
Great for traders who want consistency in how they close trades.
Limitations of Chandelier Exit
While helpful in many scenarios, the Chandelier Exit has a few drawbacks you should keep in mind.
Not ideal for sideways markets
In ranging or choppy conditions, the trailing stop can be hit often.
Stops may trigger on minor pullbacks instead of real reversals.
Works best in clean trending environments.
Can lag during fast reversals
The stop only moves in one direction — it does not adapt instantly when a trend ends.
In sharp reversals, price might hit the stop before you can react.
Does not give predictive signals — only reacts to what already happened.
Requires calibration
Default settings might not fit every strategy or market.
Needs adjustment of ATR period and multiplier to match timeframe and risk style.
A poor setting can make stops too loose or too tight.
Not a complete system on its own
Does not tell you when to enter a trade.
Should be paired with a strong entry strategy or trend filter.
Works best when combined with tools like moving averages, volume, or momentum indicators.
Best way to use Chandelier Exit

A lot of traders just slap the Chandelier Exit on their chart and leave the settings untouched. But the key is how wide or tight you set the stop and that all comes down to the multiplier. If you are trading a messy sideways stock lower the multiplier and tighten up the leash so you get out before you bleed capital. But if you are in a fast moving setup with strong momentum raise it a bit so you are not clipping your best trades too early. There is no one right setting. It is a dial you turn based on the personality of the stock.
Here is something that changes the game. Instead of using ATR from the same time frame you trade use ATR from a bigger one. So if you trade on the 15-minute chart base your stop off the one-hour ATR. This makes your stop less jumpy and ties it to the bigger price rhythm. It helps you stay in when the move is strong and cut loose when it is not. Most people treat stops like panic buttons. But if you use the Chandelier Exit with the right settings it works more like something that adapts in real time and keeps you in sync with the flow.
Conclusion
The Chandelier Exit is not some perfect solution for stops. It is just a smarter way to keep your eye on what price is really doing. Instead of guessing or using a fixed number it helps you adjust your exit in real time as the market shifts. But it only works if you take it seriously and stop using it like a tool you can just throw on a chart. Think about how fast things are moving and what kind of trade you are in. Used right it helps you hold your ground without giving it all back when the move runs out of steam.
FAQs
How does the Chandelier Exit indicator adjust to market volatility?
The Chandelier Exit dynamically sets stop-loss levels based on the Average True Range (ATR), widening or tightening depending on market volatility. In high volatility, it gives trades more room; in low volatility, it tightens stops.
Can the Chandelier Exit indicator be used for all types of financial instruments?
Yes, the Chandelier Exit can be applied to stocks, Forex, commodities, and cryptocurrencies. It works well in trending markets and across different timeframes, making it a versatile exit tool.
What is the best exit indicator?
There is no single best exit indicator, as it depends on the trader’s strategy and market conditions. Commonly used ones include Chandelier Exit, Moving Average Crossovers, Parabolic SAR, and ATR-based trailing stops.
Is Chandelier Exit a lagging indicator?
Yes, like most trend-following tools, the Chandelier Exit is a lagging indicator. It relies on past price and volatility data, which means it may react after a trend has already begun or started reversing.
Related Articles
Team that worked on the article
Oleg Tkachenko is an economic analyst and risk manager having more than 14 years of experience in working with systemically important banks, investment companies, and analytical platforms. He has been a Traders Union analyst since 2018. His primary specialties are analysis and prediction of price tendencies in the Forex, stock, commodity, and cryptocurrency markets, as well as the development of trading strategies and individual risk management systems. He also analyzes nonstandard investing markets and studies trading psychology.
Also, Oleg became a member of the National Union of Journalists of Ukraine (membership card No. 4575, international certificate UKR4494).
Chinmay Soni is a financial analyst with more than 5 years of experience in working with stocks, Forex, derivatives, and other assets. As a founder of a boutique research firm and an active researcher, he covers various industries and fields, providing insights backed by statistical data. He is also an educator in the field of finance and technology.
As an author for Traders Union, he contributes his deep analytical insights on various topics, taking into account various aspects.
Mirjan Hipolito is a journalist and news editor at Traders Union. She is an expert crypto writer with five years of experience in the financial markets. Her specialties are daily market news, price predictions, and Initial Coin Offerings (ICO).
Forex leverage is a tool enabling traders to control larger positions with a relatively small amount of capital, amplifying potential profits and losses based on the chosen leverage ratio.
Risk management in Forex involves strategies and techniques used by traders to minimize potential losses while trading currencies, such as setting stop-loss orders and position sizing, to protect their capital from adverse market movements.
ATR (Average True Range) is a volatility indicator that helps traders assess the potential price range or volatility of a financial instrument. It calculates the average of true price ranges over a specified period, providing insight into the level of price fluctuations within that timeframe.
Breakout trading is a trading strategy that focuses on identifying and profiting from significant price movements that occur when an asset's price breaches a well-defined level of support or resistance.
Swing trading is a trading strategy that involves holding positions in financial assets, such as stocks or forex, for several days to weeks, aiming to profit from short- to medium-term price swings or "swings" in the market. Swing traders typically use technical and fundamental analysis to identify potential entry and exit points.


-
 Afghanistan
-
 Albania
-
 Algeria
-
 Argentina
-
 Armenia
-
 Australia
-
 Austria
-
 Azerbaijan
-
 Bahamas
-
 Bahrain
-
 Bangladesh
-
 Belgium
-
 Botswana
-
 Brazil
-
 Brunei
-
 Bulgaria
-
 Burma
Burma
-
 Cambodia
-
 Cameroon
-
 Canada
-
 Chile
Chile
-
 China
China
-
 Colombia
-
 Costa Rica
-
 Cote d'Ivoire
-
 Croatia
-
 Cyprus
-
 Czech Republic
-
 Denmark
-
 Dominican Republic
-
 Ecuador
-
 Egypt
Egypt
-
 Estonia
-
 Eswatini
-
 Ethiopia
-
 Finland
-
 France
-
 Georgia
-
 Germany
-
 Ghana
Ghana
-
 Greece
-
 Haiti
Haiti
-
 Hong Kong
-
 Hungary
-
 India
India
-
 Indonesia
-
 Iran, Islamic republic
-
 Iraq
Iraq
-
 Ireland
-
 Israel
-
 Italy
Italy
-
 Jamaica
-
 Japan
Japan
-
 Jordan
-
 Kazakhstan
-
 Kenya
Kenya
-
 Korea
Korea
-
 Kuwait
-
 Kyrgyzstan
-
 Laos
Laos
-
 Latvia
-
 Lebanon
-
 Libyan Arab Jamahiriya
-
 Lithuania
-
 Luxembourg
-
 Macedonia
-
 Madagascar
-
 Malaysia
-
 Malta
Malta
-
 Mauritius
-
 Mexico
-
 Moldova
-
 Mongolia
-
 Montenegro
-
 Morocco
-
 Mozambique
-
 Namibia
-
 Nepal
Nepal
-
 Netherlands
-
 Nigeria
-
 Norway
-
 Oman
Oman
-
 Pakistan
-
 Palestine
-
 Papua New Guinea
-
 Peru
Peru
-
 Philippines
-
 Poland
-
 Portugal
-
 Puerto Rico
-
 Qatar
Qatar
-
 Romania
-
 Rwanda
-
 Saudi Arabia
-
 Serbia
-
 Singapore
-
 Slovakia
-
 Slovenia
-
 Somalia
-
 South Africa
-
 Spain
Spain
-
 Sri Lanka
-
 Sweden
-
 Switzerland
-
 Syrian Arab Republic
-
 Taiwan
-
 Tajikistan
-
 Tanzania, United Republic Of
-
 Thailand
-
 Trinidad and Tobago
-
 Tunisia
-
 Turkey
-
 UAE
UAE
-
 Uganda
-
 Ukraine
-
 United Kingdom
-
United States
-
 Uzbekistan
-
 Venezuela
-
 Vietnam
-
 Yemen
Yemen
-
 Zambia
-
 Zimbabwe
- Forex
- Crypto
