Best Mean Reversion Trading Strategies


Editorial Note: While we adhere to strict Editorial Integrity, this post may contain references to products from our partners. Here's an explanation for How We Make Money. None of the data and information on this webpage constitutes investment advice according to our Disclaimer.
Best mean reversion strategies are:
Strategy 1. Moving Average Crossover Strategy.
Strategy 2. RSI Divergence Strategy.
Strategy 3. Stochastic Oscillator Strategy.
Strategy 4. Fibonacci Retracement Strategy.
Strategy 5. Bollinger Bands Strategy.
Traders often look for opportunities when prices swing too far from their usual range. Mean reversion trading focuses on these moments, betting that prices will snap back to their average. It’s about spotting when the market overreacts, then stepping in with confidence. Using clear rules and market insights, traders aim to take advantage of temporary mispricings before the window closes. This isn’t just theory — it’s a practical way to trade when others might be caught off guard.In this article, we will explore the top five Forex mean reversion strategies that can provide traders with simple and easy-to-understand techniques to potentially capitalize on these reversion patterns. Read on!
Top 5 mean reversion strategies
Below are the top five mean reversion strategies that traders use to identify price extremes and profit from market corrections.
1. Moving Average Crossover strategy
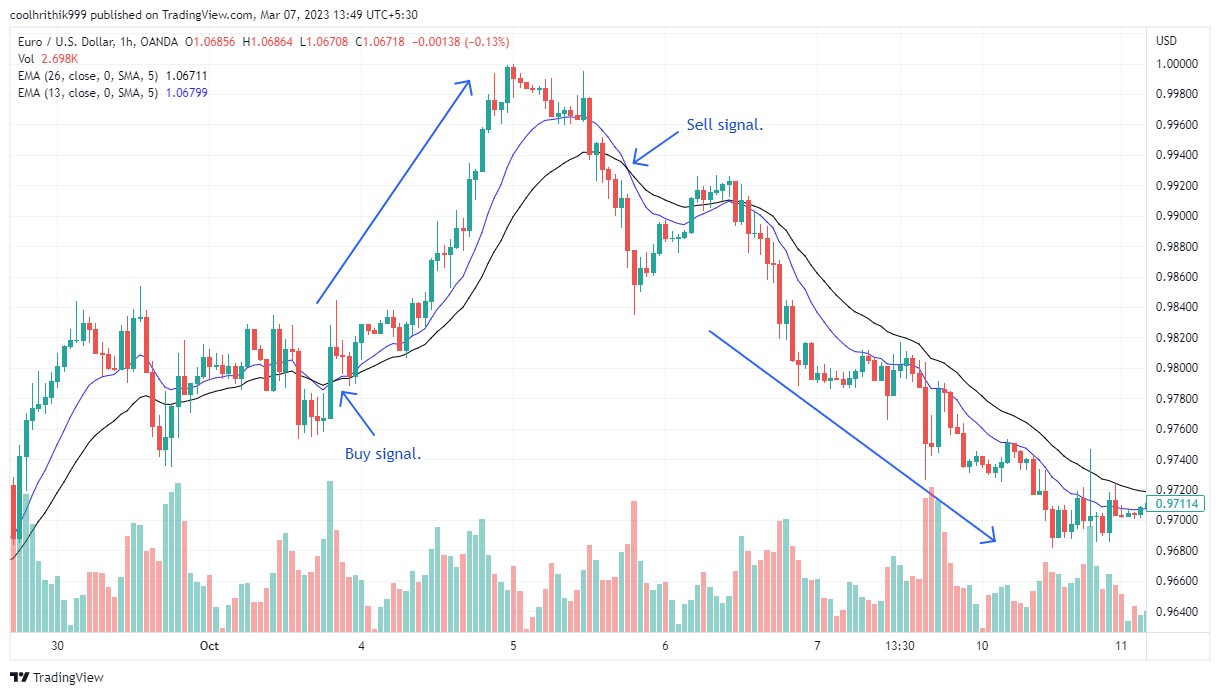
The Moving Average Crossover strategy uses two moving averages — a shorter-term and a longer-term average — to spot potential market reversals.
Entry points:
Buy signal. When the shorter-term average crosses above the longer-term average, it may signal an oversold market, suggesting a long (buy) position.
Sell signal. When the shorter-term average crosses below the longer-term average, it indicates a potentially overbought market, suggesting a short (sell) position.
Exit points:
Exit when the price returns to the mean or when the moving averages cross again, signaling a possible trend reversal.
This strategy helps traders identify potential entry and exit points by tracking price trends and market momentum.
2. RSI Divergence strategy
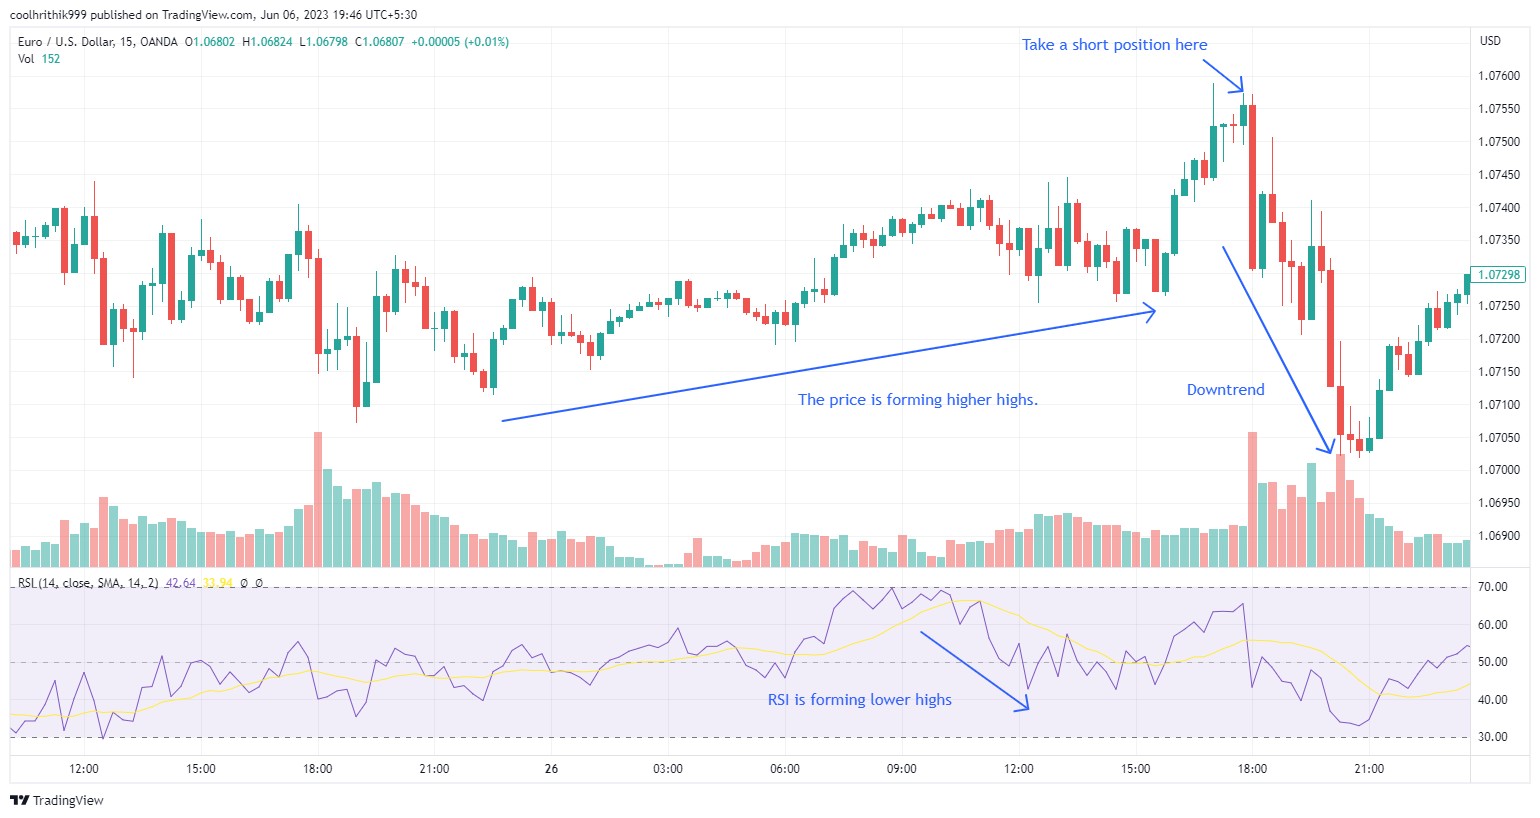
The RSI Divergence strategy uses the Relative Strength Index (RSI) to spot potential market reversals by comparing price action with RSI behavior.
Entry points
Bearish divergence. When the price makes higher highs but the RSI makes lower highs, expect a potential downward move. Consider shorting.
Bullish divergence. When the price makes lower lows but the RSI makes higher lows, anticipate an upward move. Consider going long.
Exit points
Exit when the price returns to the mean or when the divergence pattern ends, signaling a potential market reversal.
This strategy helps traders identify trend shifts before they occur, improving timing for entries and exits.
3. Stochastic Oscillator strategy
The stochastic oscillator identifies overbought and oversold market conditions, helping traders spot potential price reversals. It consists of two lines, %K and %D, oscillating between 0 and 100.
Entry points
Overbought condition. If the %K line crosses above 75 and then drops below it, the asset may be overbought, signaling a potential sell.
Oversold condition. If the %K line dips below 25 and then rises above it, the asset may be oversold, signaling a potential buy.
Traders wait for these signals to confirm a possible mean reversion trade.
Exit points
Reversion to the mean. Exit when the price returns toward the midrange (e.g., %K near 50) after an overbought or oversold signal.
Stop-loss/take-profit levels. Set stop-loss and take-profit points based on risk tolerance. This manages risk and secures profits if the market moves unpredictably.
This strategy leverages price extremes, aiming to profit from price corrections back toward average levels.
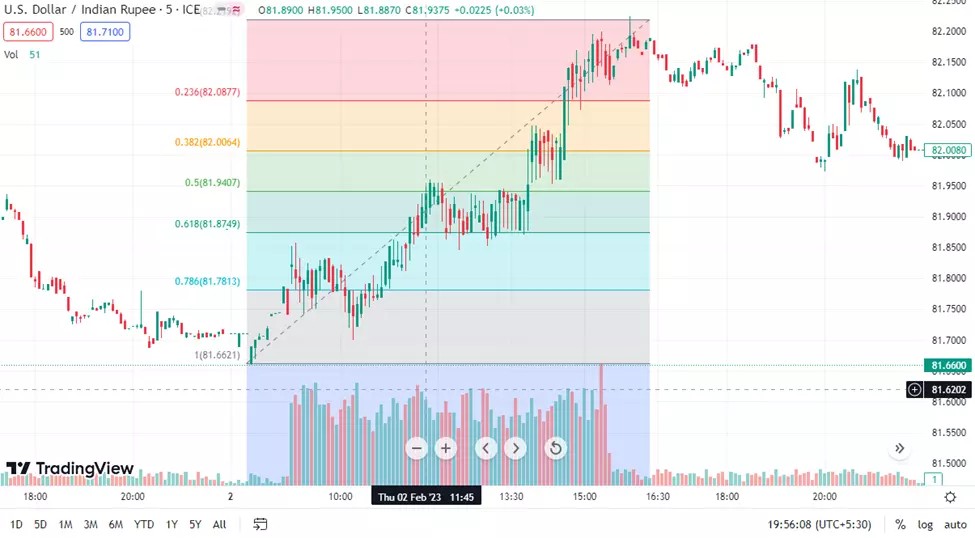
4. Fibonacci Retracement strategy
The Fibonacci Retracement strategy helps traders spot support and resistance by drawing Fibonacci levels on a chart. These levels signal potential price reversals and mean reversion trades.
Entry point
Enter a trade when the price retraces to key Fibonacci levels like 50% or 61.8%. Buy after a downtrend retracement or sell after an uptrend retracement.
Exit point
Exit when the price hits the next Fibonacci level or when the trend clearly resumes, signaling a potential price reversal or continuation.
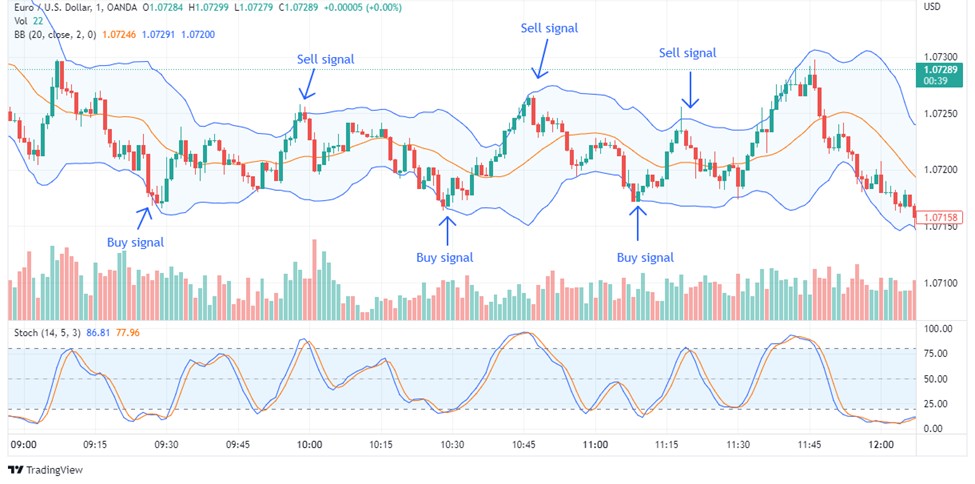
5. Bollinger Bands strategy
The Bollinger Bands strategy uses a 20-period moving average with two standard deviation bands above and below. It helps spot market volatility.
Entry points
Short position. Enter when the price moves above the upper band, signaling an overbought market likely to reverse downward.
Long position. Enter when the price drops below the lower band, indicating an oversold market likely to bounce back upward.
Exit points
Close the trade when the price returns to the moving average or touches the opposite band, signaling a potential price reversal.
This strategy helps traders anticipate market corrections and capitalize on price swings driven by volatility.

What is the mean reversion trading?
Mean reversion trading is a strategy based on the idea that asset prices tend to return to their long-term average after extreme moves. When prices deviate significantly from this average, traders expect them to reverse direction. The approach assumes that extreme price swings are unsustainable over time. Traders look for these deviations, betting that prices will move back toward the average.
Mean reversion applies across financial metrics like stock prices, volatility, and price-to-earnings (P/E) ratios. For example, if a stock's price rises far above its historical average, a trader might short it, expecting a correction.
By identifying overbought or oversold conditions, traders can capitalize on price reversals. Understanding this concept helps them create strategies that take advantage of market fluctuations and potentially improve profitability.
Mean reversion vs trend following
Trading strategies generally fall into two categories: mean reversion and trend following.
Mean reversion. This strategy bets on prices returning to their average after significant deviations. Traders identify overbought or oversold conditions, expecting a reversal toward the mean. It’s popular in range-bound markets.
Trend following. This approach focuses on riding market momentum. Traders open positions in the direction of a trend and hold them until signs of reversal appear. It works well in markets with clear upward or downward trends.
The key difference is that mean reversion targets price reversals, while trend following seeks to capitalize on sustained trends. Both require specific indicators and techniques. Understanding these strategies helps traders choose the one that best fits their style and market conditions.
How does mean reversion work?
Mean reversion works like a pendulum: when prices swing too far in one direction, they are likely to swing back, creating potential profit opportunities. The key is spotting whether the price drop is temporary or a sign of deeper issues. Hence, mean reversion theory is a statistical analysis approach utilized in trading strategies to identify abnormal market activity that is expected to return to a normal pattern.
It follows the principle of buying low and selling high by capitalizing on price swings from average values. For example, in 2022, Netflix (NFLX) saw its stock price crash from $600 to $200 after missing subscriber targets. Despite the panic, its core business remained strong, making the drop an opportunity for mean reversion traders.
By late 2022, Netflix’s price started climbing back toward its average, rewarding those who bought during the dip. However, mean reversion relies on trader sentiment when prices deviate from the norm.
Pros and cons of mean reversion trading strategy
Mean reversion trading is a popular strategy that capitalizes on asset prices returning to their historical averages, offering both potential rewards and notable risks. Below are some of its pros and cons.
- Pros
- Cons
Simple to use. Easy to understand and apply, even for beginners.
Proven history. Historical data shows consistent profitability in many markets.
Clear entry & exit. Well-defined rules help manage risk and reduce emotional trading.
Exploits market inefficiencies. Profits from temporary market imbalances and price corrections.
No guaranteed profits. Success depends on ever-changing market conditions.
Prolonged deviations. Prices can stay away from the mean longer than expected.
Identifying the mean. Finding an accurate average can be tricky due to shifting trends.
Requires patience. Waiting for prices to revert takes time and discipline.
Does the mean reversion strategy work?
Yes, mean reversion strategies can work, but they require patience. Prices don’t revert to the average instantly; it can take time or may not happen at all. This makes mean reversion less suitable for fast-paced strategies like scalping.
For better results, combine mean reversion with other trading approaches. It's essential to study the specific asset or market before using this strategy, as market conditions and fundamentals can influence how likely a price reversal is. Careful evaluation helps spot promising opportunities.
How to trade mean reversion strategy?
Here are some expert tips to help you trade a mean reversion strategy successfully:
Identify the mean. Use indicators or statistical tools to find the asset’s average price.
Spot deviations. Look for significant price deviations from the mean using technical indicators or price patterns.
Find entry points. Enter trades when the price hits extreme levels (overbought/oversold) or forms a reversal pattern.
Set stop-loss & take-profit. Use stop-loss and take-profit levels based on volatility and expected price reversion to manage risk.
Apply risk management. Control losses with position sizing and favorable risk-reward ratios to maximize gains.
Monitor & exit trades. Exit when the price reverts to the mean or hits profit targets. Close trades if the price moves against you.
Adapt to market changes. Adjust your strategy as market conditions evolve to stay aligned with new trends and patterns.
Platforms that support mean reversion strategy
Below is a comparison of the top Forex brokers that you can trade assets with using the support mean reversion strategy.
| Demo | Min. deposit, $ | FX options | Futures | ETFs | Commodities | Crypto | Stocks | Bonds | Open an account | |
|---|---|---|---|---|---|---|---|---|---|---|
| Yes | No | No | No | No | Yes | Yes | Yes | No | Open an account Your capital is at risk. |
|
| Yes | 5 | No | No | No | Yes | No | Yes | No | Open an account Your capital is at risk. |
|
| Yes | 50 | No | No | Yes | Yes | Yes | Yes | Yes | Open an account Your capital is at risk. |
|
| Yes | 100 | No | Yes | No | Yes | Yes | Yes | No | Open an account Your capital is at risk. |
|
| Yes | 100 | No | No | Yes | Yes | No | Yes | Yes | Open an account Your capital is at risk. |
Use Bollinger band spikes with RSI divergence

Many beginners get confused about mean reversion, thinking it’s just about buying oversold or selling overbought stocks. A smarter move is combining Bollinger Bands with volume spikes. When the price hits the outer Bollinger Band with a sudden volume jump, it shows a possible price reversal. But hold off until you see clear signs like a bullish engulfing or bearish pin bar candlestick pattern. This keeps you from falling for fake signals caused by random market moves.
Another advanced tactic is using RSI divergence to time your trades. Don’t trade just because RSI hits 30 or 70. Instead, watch for when the price hits a new low, but RSI doesn’t — this hints that selling pressure is fading. To confirm, add a moving average crossover to your strategy. This multi-layered setup cuts down on losing trades and boosts profits in mean reversion trading.
Conclusion
Mean reversion trading strategies offer a powerful way to profit from market fluctuations by targeting price corrections. Whether using Bollinger Bands, RSI divergence, or Fibonacci retracements, these strategies help traders identify overbought or oversold conditions and anticipate reversals. However, success depends on disciplined execution, proper risk management, and adapting to changing market conditions.
FAQs
Is mean reversion trading profitable?
Mean reversion trading can be profitable, but the same is not guaranteed. Success depends on various factors such as market conditions, strategy implementation, risk management, and trader skill.
What is the best timeframe for the mean reversion strategy?
The best timeframe for a mean reversion strategy depends on the asset being traded and the trader's preference. It can range from intraday time frames, such as minutes or hours, to longer-term timeframes, such as daily or weekly charts.
What is the best indicator for mean reversion?
There is no single best indicator for mean reversion. Traders often use a combination of indicators, such as Bollinger Bands, moving averages, RSI, or stochastics, to identify potential mean reversion opportunities. The choice of indicators depends on the trader's trading style and the asset being traded.
What is the 3-day mean reversion strategy?
The 3-day mean reversion strategy is a trading approach focused on ETFs that utilize the price highs and lows observed over a consecutive three-day period to establish potential trade opportunities.
Related Articles
Team that worked on the article
Peter Emmanuel Chijioke is a professional personal finance, Forex, crypto, blockchain, NFT, and Web3 writer and a contributor to the Traders Union website. As a computer science graduate with a robust background in programming, machine learning, and blockchain technology, he possesses a comprehensive understanding of software, technologies, cryptocurrency, and Forex trading.
Having skills in blockchain technology and over 7 years of experience in crafting technical articles on trading, software, and personal finance, he brings a unique blend of theoretical knowledge and practical expertise to the table. His skill set encompasses a diverse range of personal finance technologies and industries, making him a valuable asset to any team or project focused on innovative solutions, personal finance, and investing technologies.
Chinmay Soni is a financial analyst with more than 5 years of experience in working with stocks, Forex, derivatives, and other assets. As a founder of a boutique research firm and an active researcher, he covers various industries and fields, providing insights backed by statistical data. He is also an educator in the field of finance and technology.
As an author for Traders Union, he contributes his deep analytical insights on various topics, taking into account various aspects.
Mirjan Hipolito is a journalist and news editor at Traders Union. She is an expert crypto writer with five years of experience in the financial markets. Her specialties are daily market news, price predictions, and Initial Coin Offerings (ICO).
A Forex trading scam refers to any fraudulent or deceptive activity in the foreign exchange (Forex) market, where individuals or entities engage in unethical practices to defraud traders or investors.
Forex indicators are tools used by traders to analyze market data, often based on technical and/or fundamental factors, to make informed trading decisions.
Day trading involves buying and selling financial assets within the same trading day, with the goal of profiting from short-term price fluctuations, and positions are typically not held overnight.
A long position in Forex, represents a positive outlook on the future value of a currency pair. When a trader assumes a long position, they are essentially placing a bet that the base currency in the pair will appreciate in value compared to the quote currency.
Cryptocurrency is a type of digital or virtual currency that relies on cryptography for security. Unlike traditional currencies issued by governments (fiat currencies), cryptocurrencies operate on decentralized networks, typically based on blockchain technology.


-
 Afghanistan
-
 Albania
-
 Algeria
-
 Argentina
-
 Armenia
-
 Australia
-
 Austria
-
 Azerbaijan
-
 Bahamas
-
 Bahrain
-
 Bangladesh
-
 Belgium
-
 Botswana
-
 Brazil
-
 Brunei
-
 Bulgaria
-
 Burma
Burma
-
 Cambodia
-
 Cameroon
-
 Canada
-
 Chile
Chile
-
 China
China
-
 Colombia
-
 Costa Rica
-
 Cote d'Ivoire
-
 Croatia
-
Cyprus
-
 Czech Republic
-
 Denmark
-
 Dominican Republic
-
 Ecuador
-
 Egypt
Egypt
-
 Estonia
-
 Eswatini
-
 Ethiopia
-
 Finland
-
 France
-
 Georgia
-
 Germany
-
 Ghana
Ghana
-
 Greece
-
 Haiti
Haiti
-
 Hong Kong
-
 Hungary
-
 India
India
-
 Indonesia
-
 Iran, Islamic republic
-
 Iraq
Iraq
-
 Ireland
-
 Israel
-
 Italy
Italy
-
 Jamaica
-
 Japan
Japan
-
 Jordan
-
 Kazakhstan
-
 Kenya
Kenya
-
 Korea
Korea
-
 Kuwait
-
 Kyrgyzstan
-
 Laos
Laos
-
 Latvia
-
 Lebanon
-
 Libyan Arab Jamahiriya
-
 Lithuania
-
 Luxembourg
-
 Macedonia
-
 Madagascar
-
 Malaysia
-
 Malta
Malta
-
 Mauritius
-
 Mexico
-
 Moldova
-
 Mongolia
-
 Montenegro
-
 Morocco
-
 Mozambique
-
 Namibia
-
 Nepal
Nepal
-
 Netherlands
-
 Nigeria
-
 Norway
-
 Oman
Oman
-
 Pakistan
-
 Palestine
-
 Papua New Guinea
-
 Peru
Peru
-
 Philippines
-
 Poland
-
 Portugal
-
 Puerto Rico
-
 Qatar
Qatar
-
 Romania
-
 Rwanda
-
 Saudi Arabia
-
 Serbia
-
 Singapore
-
 Slovakia
-
 Slovenia
-
 Somalia
-
 South Africa
-
 Spain
Spain
-
 Sri Lanka
-
 Sweden
-
 Switzerland
-
 Syrian Arab Republic
-
 Taiwan
-
 Tajikistan
-
 Tanzania, United Republic Of
-
 Thailand
-
 Trinidad and Tobago
-
 Tunisia
-
 Turkey
-
 UAE
UAE
-
 Uganda
-
 Ukraine
-
 United Kingdom
-
 United States
-
 Uzbekistan
-
 Venezuela
-
 Vietnam
-
 Yemen
Yemen
-
 Zambia
-
 Zimbabwe
- Forex
- Crypto