How to Use the Traders Dynamic Index


Editorial Note: While we adhere to strict Editorial Integrity, this post may contain references to products from our partners. Here's an explanation for How We Make Money. None of the data and information on this webpage constitutes investment advice according to our Disclaimer.
The Traders Dynamic Index (TDI) helps you see momentum and trend strength in one glance by blending RSI, moving averages, and volatility bands. Watch how the green line (RSI) pulls away from the red and yellow lines during strong moves, not just when they cross. When the outer bands expand alongside a breakout, it often signals real momentum, not noise. Reading these subtle shifts early helps you catch trades before the big breakout happens.
The Traders Dynamic Index (TDI) is more than a typical tool. It combines trend momentum and volatility in one view so you can read the market with more clarity. What makes it work is not just when the lines cross but how they pull apart when a move has strength. When the green line breaks away from the red and yellow during a surge and the outer bands expand, that is real movement — not a false signal. Most people use TDI like a rulebook. But if you learn to read how the lines react under pressure, you will catch moves while they are forming not after they break. In this article, we will take a detailed look into this indicator, including its origin, key components, and top trading strategies.
Introduction to TDI indicator
The traders dynamic index is a powerful all-in-one indicator that combines elements of trend, momentum, and volatility into a single visual. It brings together the RSI (Relative Strength Index), moving averages, and volatility bands to help traders spot potential setups, filter signals, and make more confident decisions.
It reduces the need for multiple indicators on the chart. Instead of switching between RSI, Bollinger Bands, and moving averages, the TDI displays everything in one panel, making it ideal for those who want a clean chart with strong signal clarity.
What the TDI indicator includes
RSI line tracks momentum and strength of price.
Signal line is a moving average of the RSI to smooth short-term shifts.
Volatility bands (similar to Bollinger Bands) expand and contract based on market movement.
Crossovers and divergence between lines help identify entry or exit points.
Origin and development of TDI indicator
The TDI indicator was developed by Dean Malone as part of his trading system designed for simplicity and clarity. It was first introduced to help Forex traders read market conditions more effectively without relying on multiple, separate tools.
Why it was created
Dean Malone wanted an indicator that combined price strength, direction, and volatility.
The goal was to simplify chart reading and remove noise.
It quickly gained popularity among traders using MetaTrader and other platforms.
How it evolved
TDI started as a custom MetaTrader indicator used mostly in Forex forums.
It became widely adopted by traders who favored structured, rules-based systems.
Today, it’s used in strategies like Synergy Pro and by traders who follow clean, rule-driven charts.
Why it still matters
Combines momentum and volatility in one place.
Ideal for traders who prefer a simple yet data-rich setup.
Helps filter out noise and reduce screen clutter.
Understanding the TDI indicator
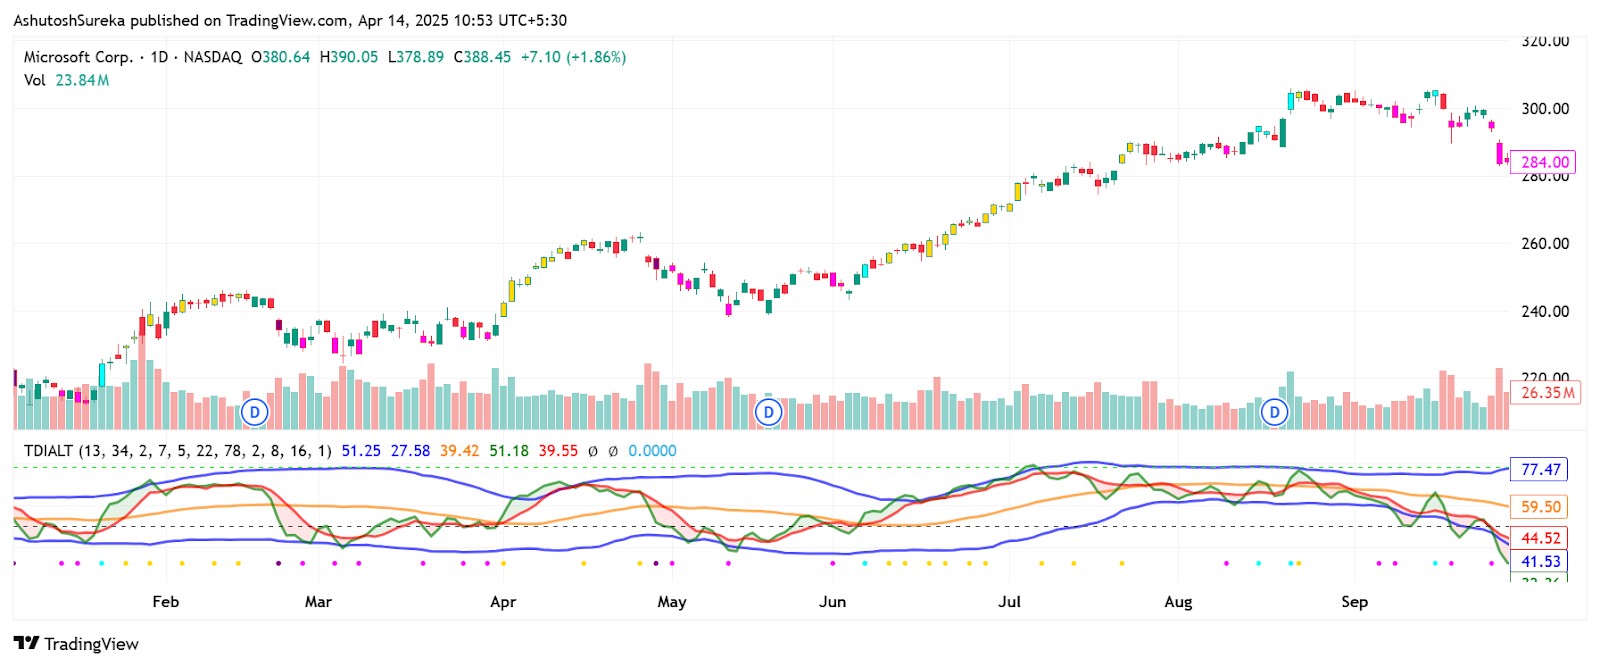
The traders dynamic index combines several well-known tools into a single chart window, making it easier to analyze the market without crowding your screen. It brings together the RSI, moving averages, and volatility bands — all working together to show market strength, trend direction, and volatility.
The five core components of the TDI
1. RSI price line (green)
This is the core of the TDI.
It’s based on the RSI, showing the strength and momentum of price.
When the green line rises, momentum is bullish; when it falls, momentum is bearish.
2. Trade signal line (red)
This is a moving average of the RSI line.
It smooths out quick RSI fluctuations to help confirm direction.
Crossovers with the green line often signal entry or exit points.
3. Market base line (yellow)
A slower-moving average that shows the longer-term direction of the market.
It acts as a filter — green and red lines above the yellow suggest a bullish environment.
If both are below the yellow line, the market bias is bearish.
4. Volatility band upper (blue)
Similar to Bollinger Bands, this line expands when the market is active.
It sets the upper range of price volatility.
When the green line nears this band, price may be overextended.
5. Volatility band lower (blue)
This is the bottom of the volatility range.
When the green line touches or crosses it, the market could be oversold or reversing.
Useful for spotting bounce zones or exhaustion points.
How to set up TDI indicator
The traders dynamic index is available as a custom indicator on most popular trading platforms. Once installed, it shows multiple lines in a separate window, helping you track trend, momentum, and volatility in one place. Setting it up only takes a few steps.
Access the indicator
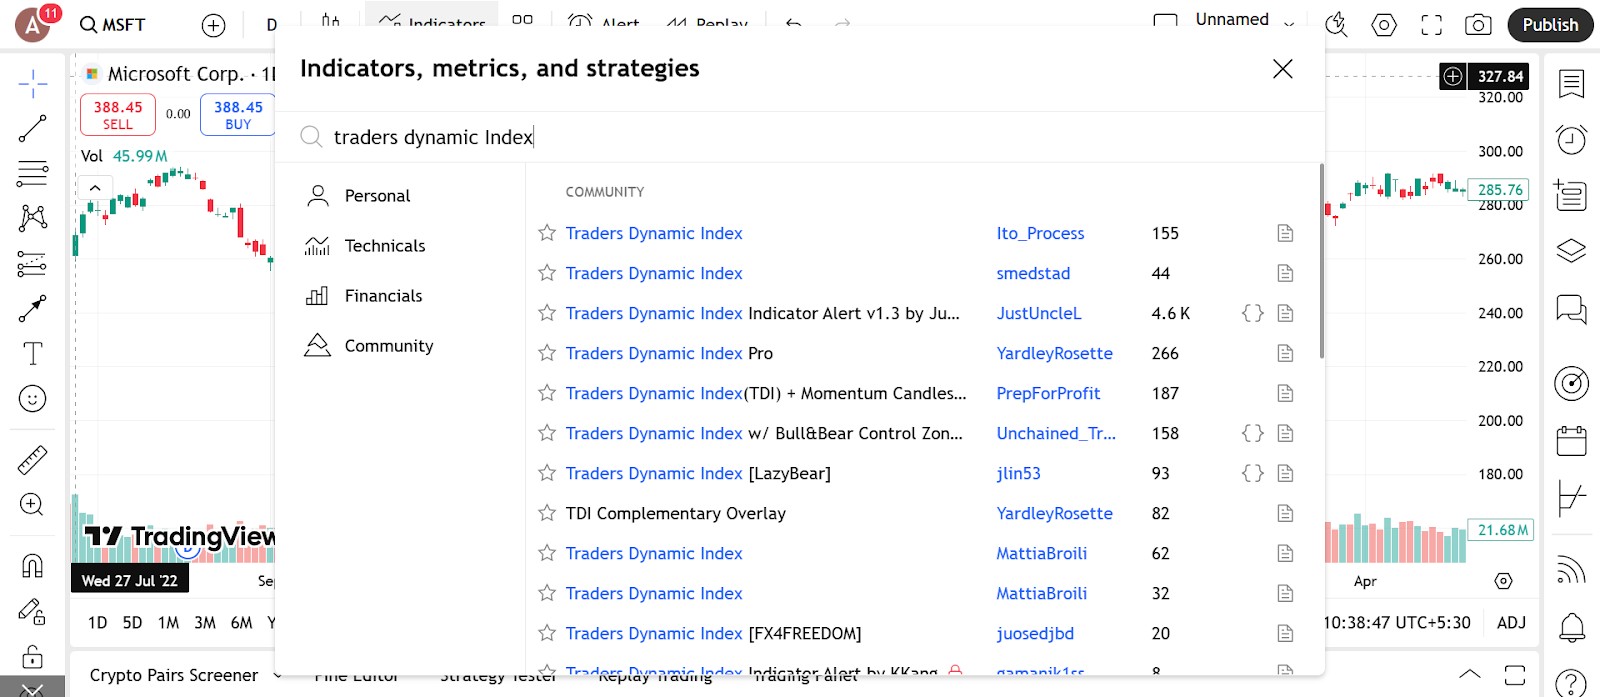
Adding the TDI indicator to your chart is fast and straightforward.
How to do it
Open the Indicators menu on your charting platform.
In the search bar, enter the TDI indicator to quickly locate it.
Select one of the available TDI options and click to apply it.
The TDI lines will automatically display in a separate pane below your main price chart, ready for your analysis.
Where it’s available
The indicator comes pre-installed on platforms like TradingView, MetaTrader 4 and 5, ThinkorSwim, and most major charting tools.
No additional downloads or plug-ins are needed — it’s ready to use right out of the box.
Configure the parameters
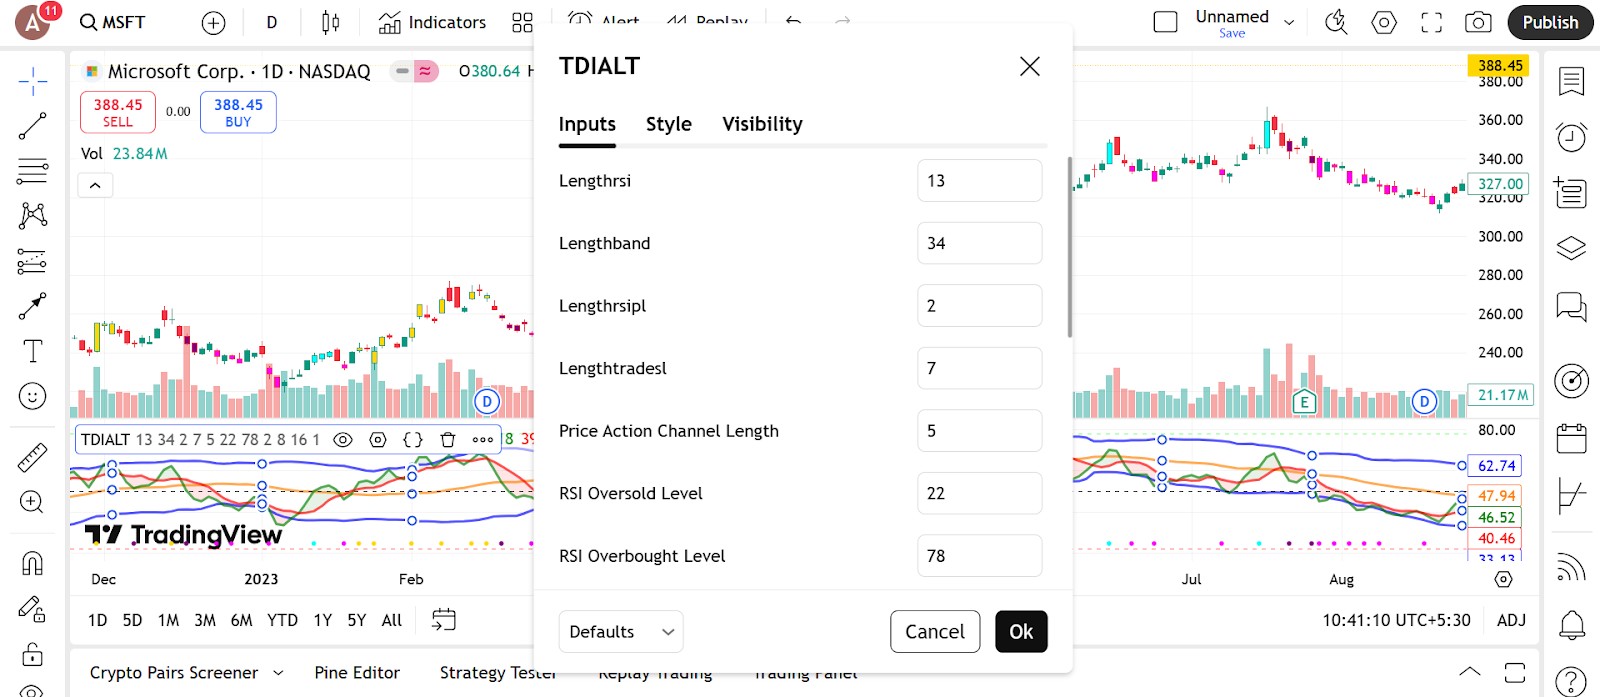
Once added, you can tweak the inputs to fit your trading style.
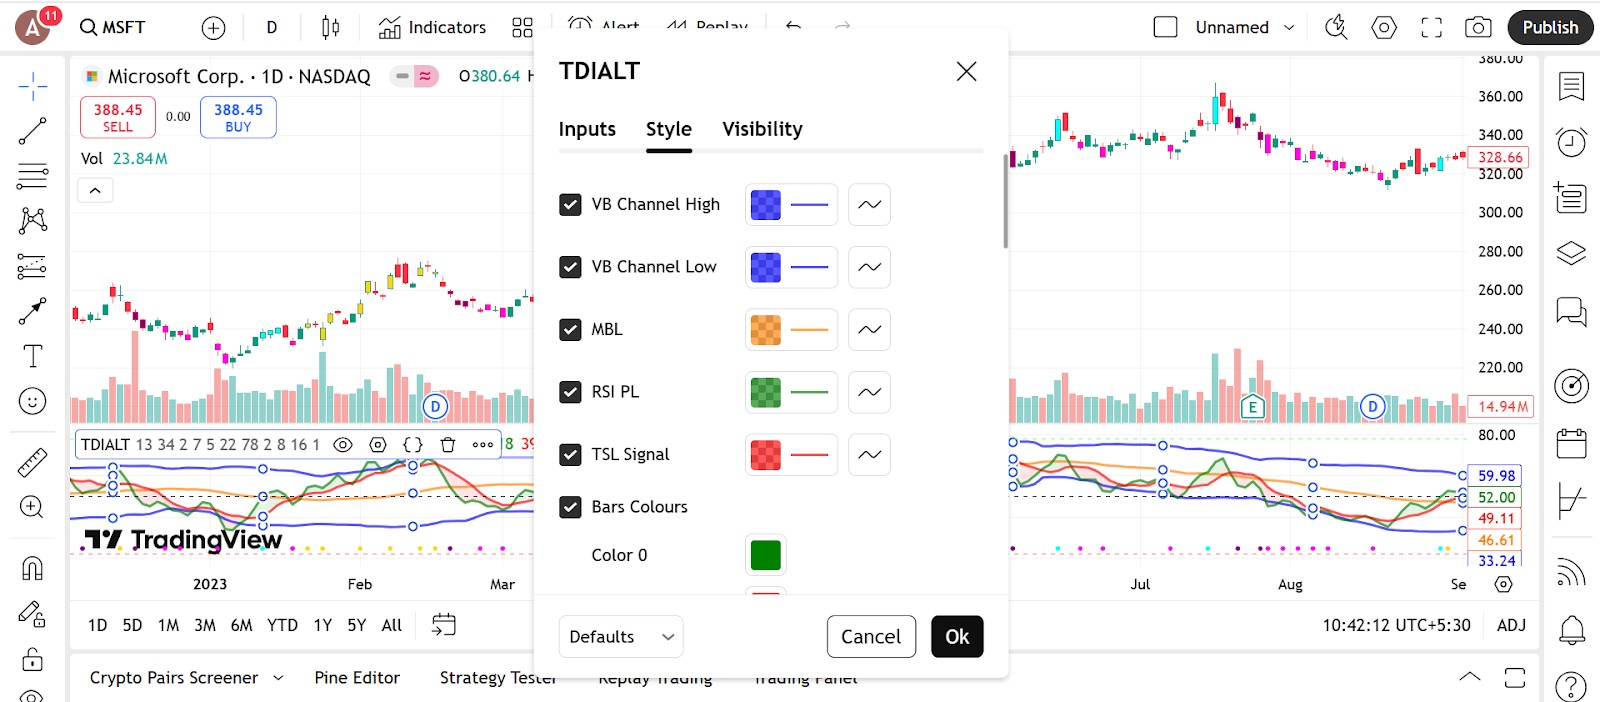
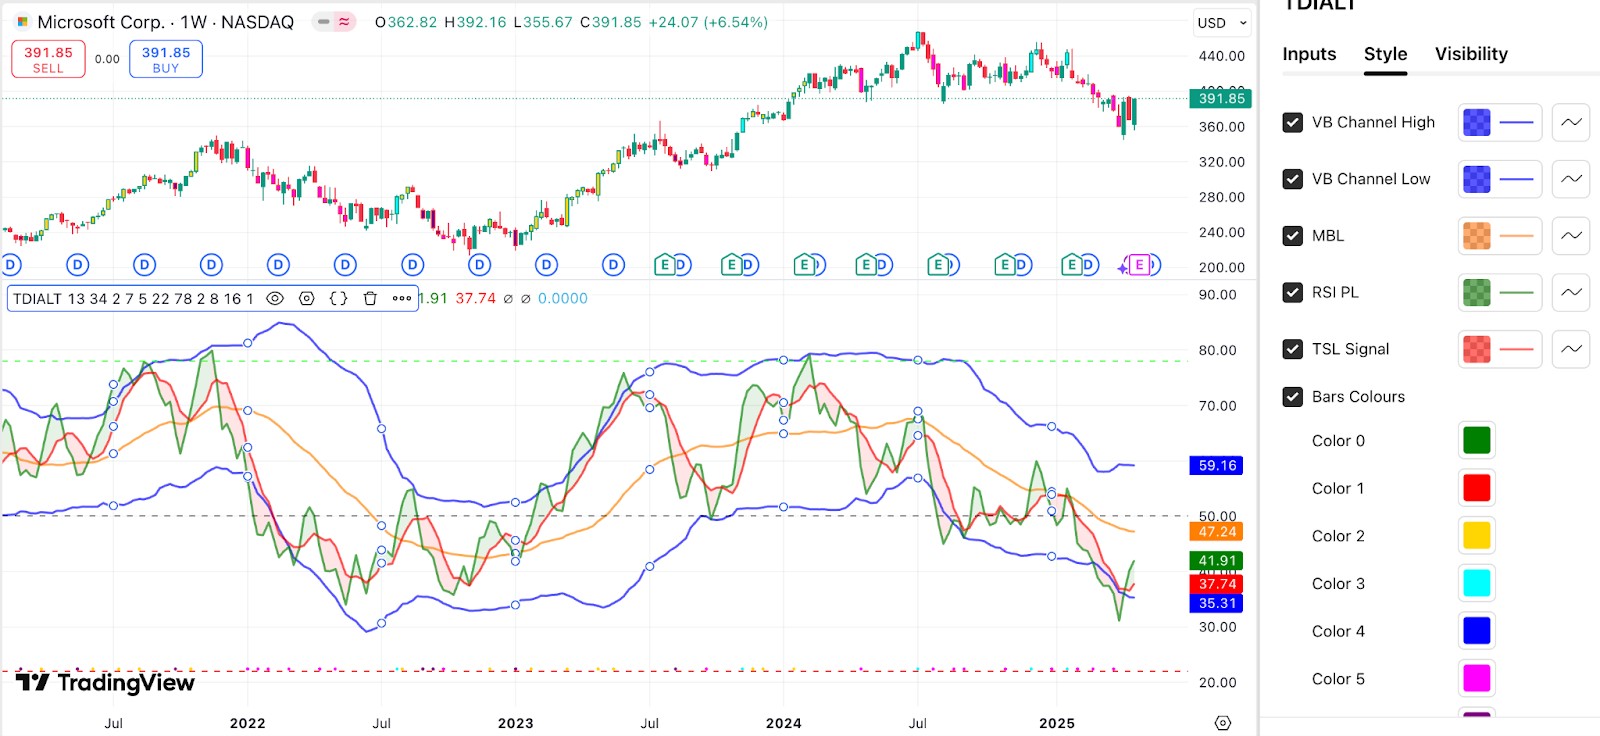
What you can adjust
RSI period
Controls how sensitive the green line is. A smaller number reacts faster, while a larger one smooths things out.Signal line smoothing
Averages the green RSI line into the red signal line. You can adjust how quickly or slowly it responds.Volatility band settings
You can change how the blue bands react to price movement, similar to adjusting Bollinger Bands.Line colors and thickness
Customize each line to match your chart theme for better visibility.
Setup tips
Start with the default settings: RSI period 13, signal 2, and volatility bands 34.
Use different colors for each line so it’s easier to read.
Make sure you test it on a demo account before trading live.
Trading strategies using TDI indicator
You can use the TDI indicator for entries, exits, and filtering trades across different market conditions. The most common strategies revolve around crossovers, divergence, and market direction relative to the baseline.
RSI and signal line crossover strategy
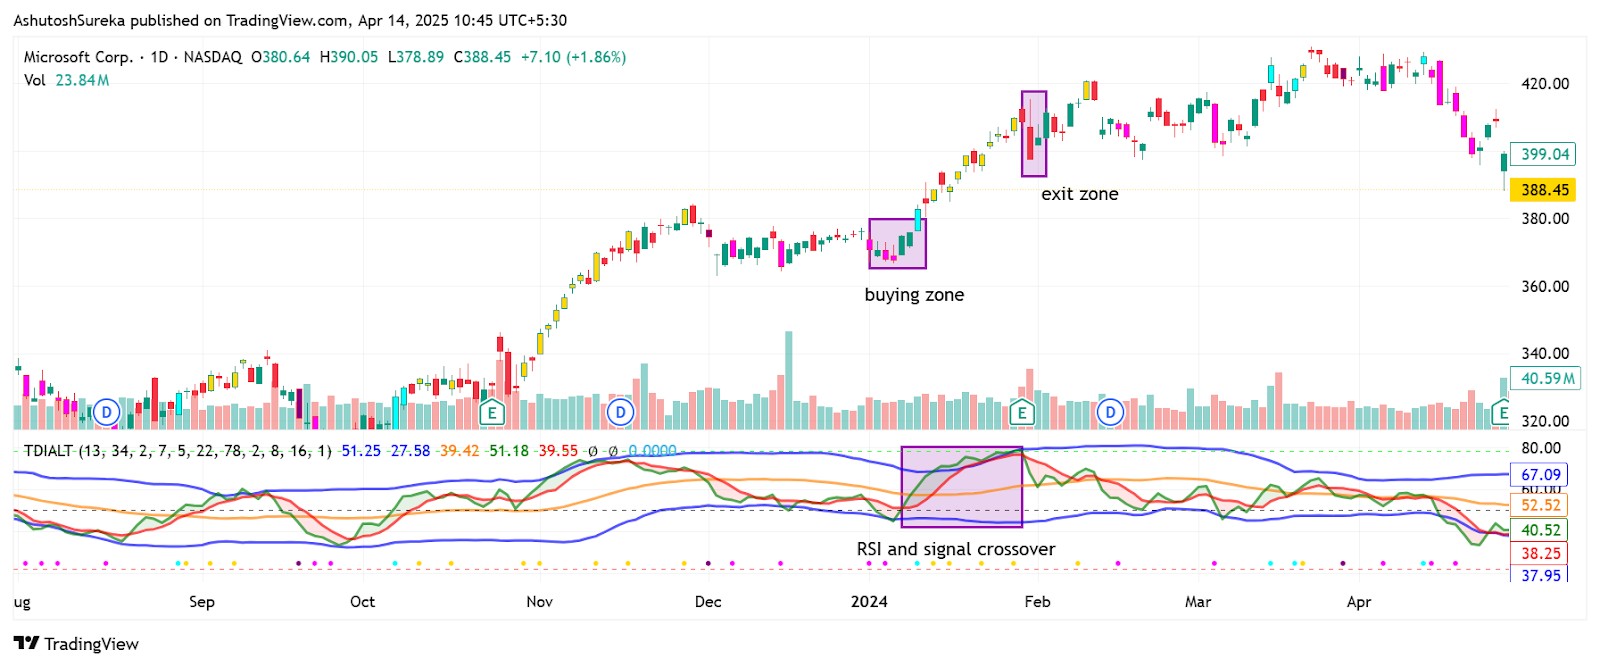
This is the most common way traders use the TDI. It focuses on the crossover between the green RSI line and the red signal line.
How to apply
A buy setup occurs when the green line crosses above the red line, ideally near or above the yellow baseline.
A sell setup happens when the green line crosses below the red line, especially if both are below the yellow line.
Stronger setups occur when all lines are aligned in the same direction.
Why it works
Offers clear and simple entry signals.
Reduces noise compared to standalone RSI.
Adds trend confirmation using the yellow baseline.
Bounce strategy from the volatility band

This setup looks for price exhaustion or reversals when the green RSI line touches or moves outside the blue bands.
How to apply
If the green line hits or crosses above the upper blue band and then turns down, consider a short entry.
If the green line drops to or below the lower band and then bounces up, look for a buy signal.
Confirm the move with a candle pattern or price structure.
Why it works
Helps catch reversals after price overextends.
Uses volatility zones for early warning.
Works best with confirmation from chart levels.
Baseline trend filter strategy

The yellow market baseline acts as a filter to decide whether you should look for long or short trades.
How to apply
Look for buy trades when the green and red lines are above the yellow line.
Look for sell trades when both are below the yellow line.
Skip trades when lines are flat or crossing back and forth.
Why it works
Keeps you trading with the trend.
Filters out weak or choppy setups.
Makes trade direction easier to define.
TDI divergence strategy
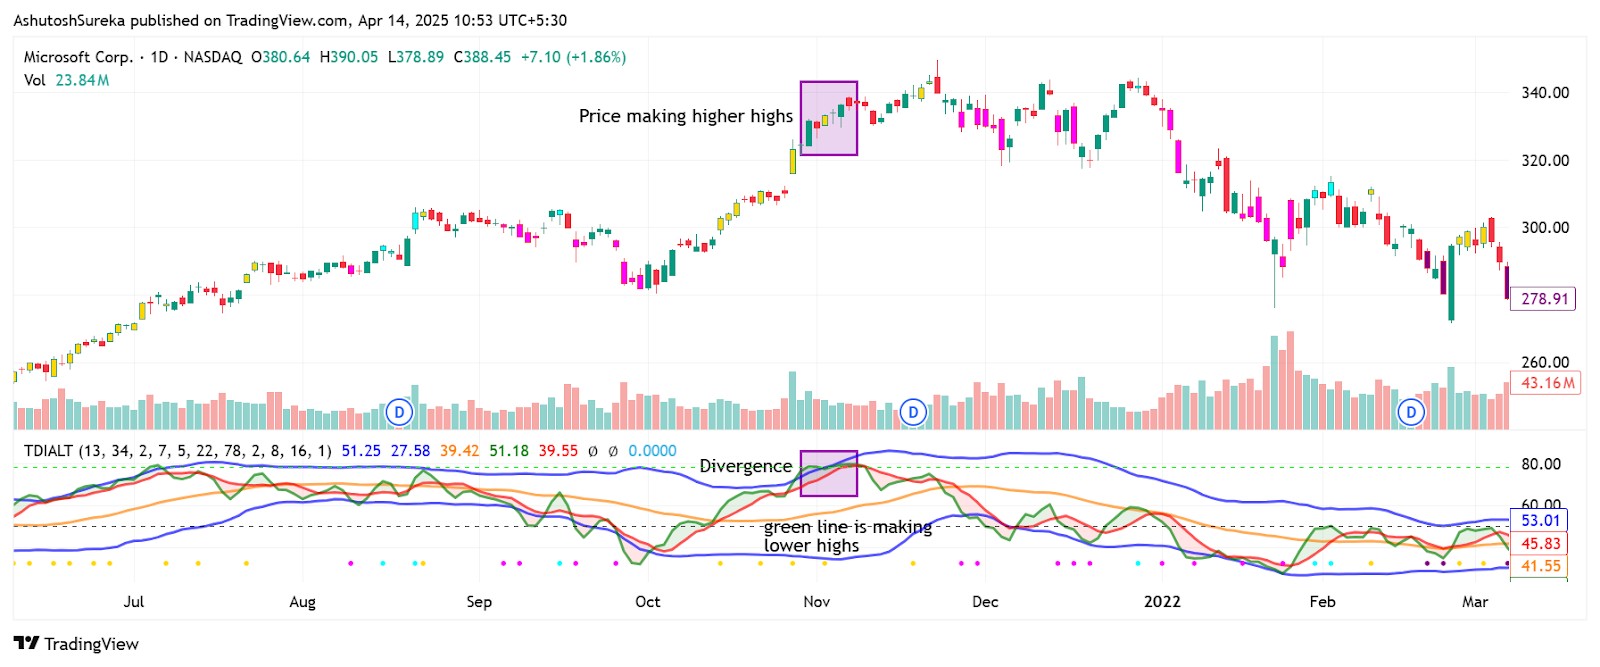
Divergence between the TDI green line and price can signal a reversal or fading strength.
How to apply
If the price forms a higher high while the green RSI line forms a lower high, this may signal a bearish divergence.
Conversely, if the price creates a lower low but the green RSI line forms a higher low, it often indicates a bullish divergence.
For more accurate trade entries, it's best to combine these divergence signals with key support and resistance levels.
Why it works
Gives early warning of trend weakness.
Helps you avoid getting caught at the end of a move.
Adds another layer to your analysis.
If you depend on multiple technical indicators, selecting a broker that supports advanced platforms is a smart move. These platforms have charting tools, a broad selection of indicators, and customization options tailored to virtually any trading approach. To help you make an informed decision, we’ve compiled a table of the best brokers offering access to these platforms.
| Currency pairs | Crypto | Stocks | Min. deposit, $ | Max. leverage | TradingView | MT5 | cTrader | Regulation | TU overall score | Open an account | |
|---|---|---|---|---|---|---|---|---|---|---|---|
| 90 | Yes | Yes | No | 1:500 | Yes | Yes | Yes | ASIC, FCA, DFSA, BaFin, CMA, SCB, CySec | 7.17 | Open an account Your capital is at risk.
|
|
| 52 | Yes | Yes | 25 | 1:1000 | No | Yes | Yes | MISA, FSC (Mauritius) | 8.2 | Open an account Your capital is at risk. |
|
| 70 | Yes | Yes | 100 | 1:500 | No | Yes | Yes | FCA, CYSEC, FSCA, SCB, FSA (Seychelles) | 7.9 | Open an account Your capital is at risk. |
|
| 56 | Yes | Yes | 50 | 1:1000 | No | Yes | Yes | CySEC, FSC (Mauritius), SVG FSA | 7.87 | Open an account Your capital is at risk. |
|
| 61 | Yes | Yes | 200 | 1:500 | Yes | Yes | Yes | ASIC, CySEC, and FSA | 7.46 | Open an account Your capital is at risk. |
Why trust us
We at Traders Union have analyzed financial markets for over 14 years, evaluating brokers based on 250+ transparent criteria, including security, regulation, and trading conditions. Our expert team of over 50 professionals regularly updates a Watch List of 500+ brokers to provide users with data-driven insights. While our research is based on objective data, we encourage users to perform independent due diligence and consult official regulatory sources before making any financial decisions.
Learn more about our methodology and editorial policies.
Pros and cons of TDI indicator
- Pros
- Cons
Combines multiple tools into one panel. The TDI includes RSI, moving averages, and volatility bands — all in one window. This means you don’t have to use three separate indicators, which keeps your charts clean and focused.
Helps confirm entries and exits. Crossover signals, band touches, and alignment with the baseline give clear entry and exit ideas. It also filters out weak trades by showing if momentum agrees with the trend.
Works across timeframes and strategies. Whether you’re scalping or swing trading, the TDI adapts well. You can use it for trend following, reversals, or even as a confirmation tool alongside other indicators.
Built-in trend filter. The yellow baseline helps you stay on the right side of the market. You can avoid going against the main direction by checking if the green and red lines are above or below it.
Not included by default on most platforms. You need to download or install the TDI manually on platforms like MetaTrader or TradingView. That adds a step before you can start using it.
Can get crowded for new users. With five different lines moving at once, the chart can look confusing until you get used to reading it. Beginners may struggle with signal clarity at first.
Lagging in fast markets. Since the TDI relies on smoothed RSI and moving averages, it may respond late during fast-moving breakouts or news events.
Still needs confirmation. While TDI is powerful, it doesn’t replace price action. You still need to check support, resistance, and overall market structure to avoid false signals.
Spot early momentum by watching line separation and band expansion

The part most traders skip over in TDI is when the green RSI line breaks away hard from the red signal line but the yellow baseline stays flat. This setup means price is making a run but the bigger trend is still flat. That hesitation is where the edge is. If the green keeps pushing and the red starts curving up slowly to follow, you are seeing momentum trying to lead the trend. You are not betting on a confirmed move. You are betting on momentum building. By the time all three lines agree, the trade is usually too late.
Something new traders do not usually see is how the volatility bands react during a fake move. If price spikes and the green line jumps but the bands stay tight, the move is probably retail emotion, not real push. It fades fast. But when the bands expand first and the green crosses with speed, the market has something behind it. Use the bands to help block out the noise. TDI is not just green above red. It is about the speed and commitment in the move. And that is where the edge really comes from.
Conclusion
TDI is not about picture-perfect setups. It shows you how pressure moves in real time. The more attention you give to how the lines stretch and shift around volatility, the better you get at spotting when a move actually matters. Let the green show what short-term traders are doing. Let the yellow remind you where the trend stands. Let the bands tell you if the move is serious. This is not about following rules. It is about learning to feel the flow. And once that clicks, TDI becomes more than a tool; it becomes something you can trust in the middle of the mess.
FAQs
Is the TDI suitable for Forex trading only?
No, the Traders Dynamic Index is not limited to Forex and can be used across other markets like stocks and crypto. However, it is especially popular in Forex due to its multi-layered signal structure.
Should I use TDI alone or with other indicators?
While TDI is a comprehensive tool combining RSI, moving averages, and volatility bands, it is more effective when used with price action or support and resistance analysis for confirmation.
Can I use TDI Indicator for day trading?
Yes, TDI is well-suited for day trading as it helps identify short-term trend direction, momentum, and entry points. It works best on lower time frames like 5 or 15-minute charts.
Does the TDI indicator repaint?
The classic TDI does not repaint, but some custom or modified versions may do so depending on how they are coded. It’s important to use a trusted version to avoid misleading signals.
Related Articles
Team that worked on the article
Anton Kharitonov is an active trader and analyst. He employs both short- and long-term trading strategies, primarily based on fundamental factors, supported by technical indicators and intermarket analysis. Anton trades major and minor currency pairs, while his primary focus is on oil futures and index CFDs.
As a financial expert and analyst at Traders Union since 2013, Anton performs thorough internal broker evaluations, referred to as “test drives.” He examines website and account interfaces, client support, software stability, deposit and withdrawal processing speed, legal documentation, and additional broker services such as VPS, affiliate programs, contests, bonuses, and training programs.
New knowledge is the key to expanding our horizons and unlocking new opportunities. Every step in learning, every new understanding empowers us become better, smarter, and stronger. Knowledge provides an advantage, enabling informed decisions, confident actions, and forward momentum. In a changing world, only those who embrace learning and adaptation can truly thrive.
Based on these evaluations, Anton prepares expert reports on the operation of Forex, stock, binary options, and cryptocurrency exchanges.
Chinmay Soni is a financial analyst with more than 5 years of experience in working with stocks, Forex, derivatives, and other assets. As a founder of a boutique research firm and an active researcher, he covers various industries and fields, providing insights backed by statistical data. He is also an educator in the field of finance and technology.
As an author for Traders Union, he contributes his deep analytical insights on various topics, taking into account various aspects.
Mirjan Hipolito is a journalist and news editor at Traders Union. She is an expert crypto writer with five years of experience in the financial markets. Her specialties are daily market news, price predictions, and Initial Coin Offerings (ICO).
Divergence serves as a valuable concept for predicting potential shifts in market direction. It happens when the price movement of a currency pair and a particular technical indicator do not conform, but rather go in opposite directions.
A trading system is a set of rules and algorithms that a trader uses to make trading decisions. It can be based on fundamental analysis, technical analysis, or a combination of both.
Swing trading is a trading strategy that involves holding positions in financial assets, such as stocks or forex, for several days to weeks, aiming to profit from short- to medium-term price swings or "swings" in the market. Swing traders typically use technical and fundamental analysis to identify potential entry and exit points.
Forex indicators are tools used by traders to analyze market data, often based on technical and/or fundamental factors, to make informed trading decisions.
Volatility refers to the degree of variation or fluctuation in the price or value of a financial asset, such as stocks, bonds, or cryptocurrencies, over a period of time. Higher volatility indicates that an asset's price is experiencing more significant and rapid price swings, while lower volatility suggests relatively stable and gradual price movements.


-
 Afghanistan
-
 Albania
-
 Algeria
-
 Argentina
-
 Armenia
-
 Australia
-
 Austria
-
 Azerbaijan
-
 Bahamas
-
 Bahrain
-
 Bangladesh
-
 Belgium
-
 Botswana
-
 Brazil
-
 Brunei
-
 Bulgaria
-
 Burma
Burma
-
 Cambodia
-
 Cameroon
-
 Canada
-
 Chile
Chile
-
 China
China
-
 Colombia
-
 Costa Rica
-
 Cote d'Ivoire
-
 Croatia
-
 Cyprus
-
 Czech Republic
-
 Denmark
-
 Dominican Republic
-
 Ecuador
-
 Egypt
Egypt
-
 Estonia
-
 Eswatini
-
 Ethiopia
-
 Finland
-
 France
-
 Georgia
-
 Germany
-
 Ghana
Ghana
-
 Greece
-
 Haiti
Haiti
-
 Hong Kong
-
 Hungary
-
 India
India
-
 Indonesia
-
 Iran, Islamic republic
-
 Iraq
Iraq
-
 Ireland
-
 Israel
-
 Italy
Italy
-
 Jamaica
-
 Japan
Japan
-
 Jordan
-
 Kazakhstan
-
 Kenya
Kenya
-
 Korea
Korea
-
 Kuwait
-
 Kyrgyzstan
-
 Laos
Laos
-
 Latvia
-
 Lebanon
-
 Libyan Arab Jamahiriya
-
 Lithuania
-
 Luxembourg
-
 Macedonia
-
 Madagascar
-
 Malaysia
-
 Malta
Malta
-
 Mauritius
-
 Mexico
-
 Moldova
-
 Mongolia
-
 Montenegro
-
 Morocco
-
 Mozambique
-
 Namibia
-
 Nepal
Nepal
-
 Netherlands
-
 Nigeria
-
 Norway
-
 Oman
Oman
-
 Pakistan
-
 Palestine
-
 Papua New Guinea
-
 Peru
Peru
-
 Philippines
-
 Poland
-
 Portugal
-
 Puerto Rico
-
 Qatar
Qatar
-
 Romania
-
 Rwanda
-
 Saudi Arabia
-
 Serbia
-
 Singapore
-
 Slovakia
-
 Slovenia
-
 Somalia
-
 South Africa
-
 Spain
Spain
-
 Sri Lanka
-
 Sweden
-
 Switzerland
-
 Syrian Arab Republic
-
 Taiwan
-
 Tajikistan
-
 Tanzania, United Republic Of
-
 Thailand
-
 Trinidad and Tobago
-
 Tunisia
-
 Turkey
-
 UAE
UAE
-
 Uganda
-
 Ukraine
-
 United Kingdom
-
United States
-
 Uzbekistan
-
 Venezuela
-
 Vietnam
-
 Yemen
Yemen
-
 Zambia
-
 Zimbabwe
- Forex
- Crypto
