

-3.08% for CrowdStrike stock as early gap down sparks selling

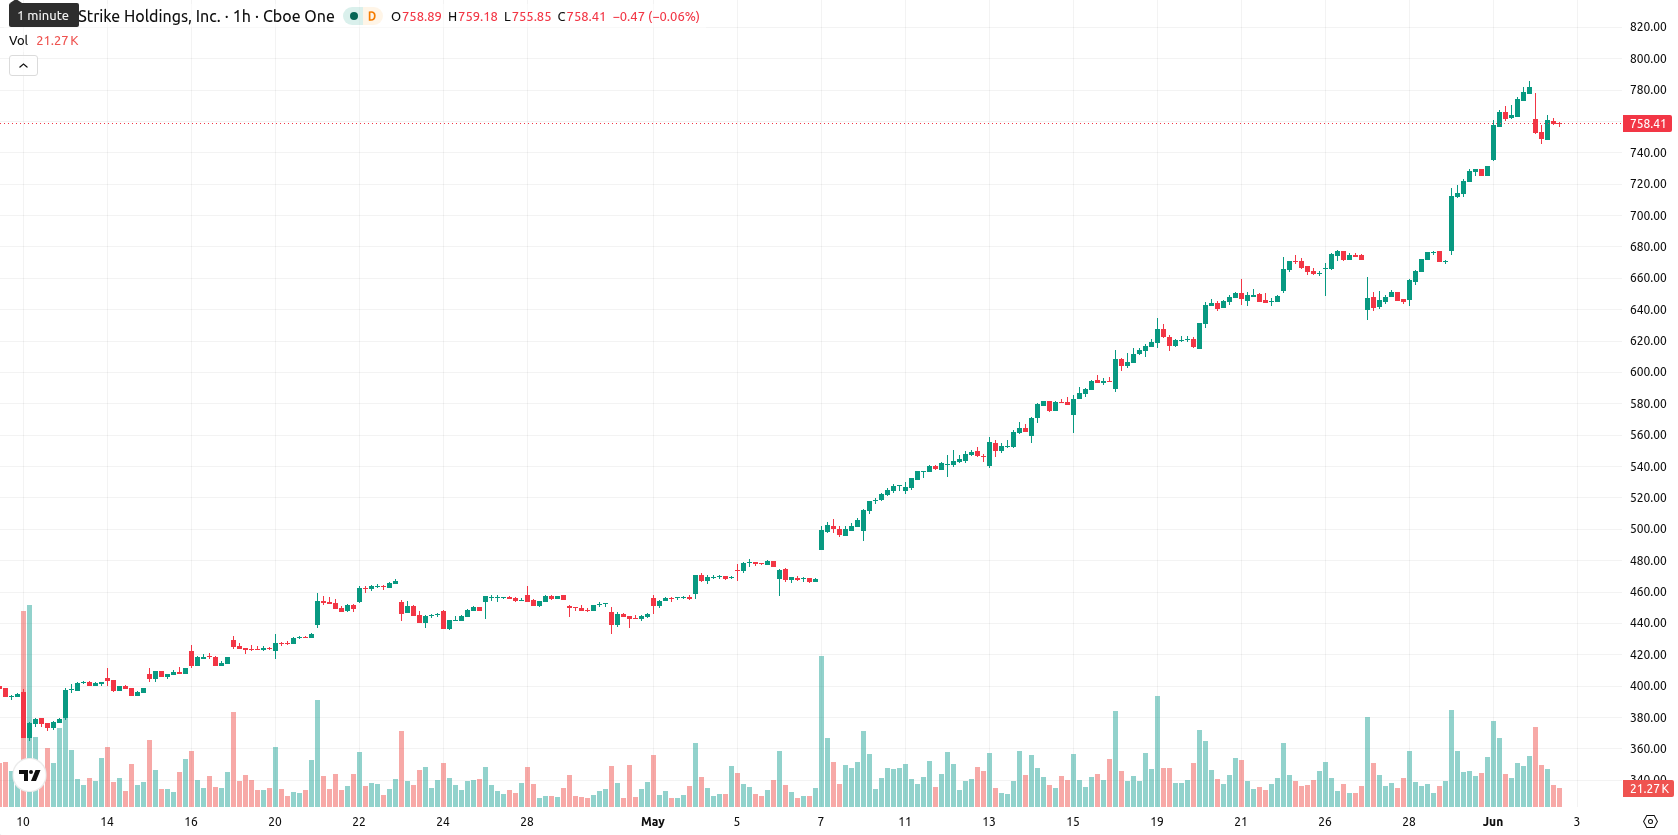
CrowdStrike Holdings Inc. (CRWD) stock is trading at $757.93, down 3.08% on the day. The price remains well above its key moving averages, while intraday action shows increased volatility and sustained downside pressure.
 267.57
276.24
267.57
276.24
Highlights
- CrowdStrike will report Q1 fiscal 2027 earnings on June 3, 2026, prompting investors to reposition ahead of new results.
- Pre-earnings anticipation is increasing trading activity amid ongoing selling pressure and a focus on upcoming management commentary.
- Despite strong bullish momentum, the stock is overbought and volatile, with price expected to consolidate between $746.00 and $800.00, but a sustained drop is unlikely unless $746 breaks.
Pre-earnings positioning shifts as investors brace for CrowdStrike's report
CrowdStrike Holdings Inc has scheduled the release of its first-quarter fiscal 2027 earnings for June 3, 2026, after market close. The announcement of the upcoming report has prompted investors to adjust positions in advance, as the market awaits confirmed figures and management commentary regarding recent business developments. Ongoing pre-earnings anticipation has influenced trading activity, though price action has remained under broader selling pressure.
Bullish momentum signals persist amid volatility and overbought readings
Technically, CRWD has traded well above the SMA-20 at $598.32, SMA-50 at $489.48, and SMA-200 at $471.96. The Ichimoku Kijun on the daily chart stands at $608.77, creating immediate support beneath the current price. Momentum remains strong, as indicated by MACD and ADX on D1 timeframes flashing buy conditions, with the Awesome Oscillator confirming prevailing upside. However, oscillators including RSI at 86.71, Stoch RSI at 93.42, and CCI at 167.27 all register deeply overbought readings, while BBP signals strong buyer dominance. Despite the predominantly bullish technicals, today's session saw heightened volatility and a gap down open, resulting in price closing near the lower end of the day's range between $746.00 and $763.39.
High upside probability as consolidation tempers breakout risks
Over the next five trading days, CRWD's typical volatility band is anticipated between $746.00 and $800.00. There is a very high probability—exceeding 80%—of upward price movement, with a baseline scenario of sideways consolidation as the market digests recent gains amid overbought conditions. Any decisive breakout above $800 could fuel further upside momentum, while a close below $746 may encourage additional profit-taking toward the next key supports.
Earlier, analysts noted that CrowdStrike’s strong momentum and heightened investor anticipation ahead of earnings positioned the stock for continued strength. With the latest session underscoring increased volatility and overbought extremes, traders should monitor price action for signs of a breakout above $800 or a close below $746, which could define the next directional move.









-
 Afghanistan
-
 Albania
-
 Algeria
-
 Angola
-
 Argentina
-
 Armenia
-
 Australia
-
 Austria
-
 Azerbaijan
-
 Bahamas
-
 Bahrain
-
 Bangladesh
-
 Belarus
-
 Belgium
-
 Bolivia
-
 Botswana
-
 Brazil
-
 Brunei
-
 Bulgaria
-
 Cambodia
-
 Cameroon
-
 Canada
-
 Chile
Chile
-
 China
China
-
 Colombia
-
 Congo
Congo
-
 Costa Rica
-
 Cote d'Ivoire
-
 Croatia
-
 Cuba
Cuba
-
 Cyprus
-
 Czechia
-
 DR Congo
-
 Denmark
-
 Dominican Republic
-
 Ecuador
-
 Egypt
Egypt
-
 El Salvador
-
 Estonia
-
 Eswatini
-
 Ethiopia
-
 Finland
-
 France
-
 Georgia
-
 Germany
-
 Ghana
Ghana
-
 Greece
-
 Haiti
Haiti
-
 Hong Kong
-
 Hungary
-
 India
India
-
 Indonesia
-
 Iran, Islamic republic
-
 Iraq
Iraq
-
 Ireland
-
 Israel
-
 Italy
Italy
-
 Jamaica
-
 Japan
Japan
-
 Jordan
-
 Kazakhstan
-
 Kenya
Kenya
-
 Korea
Korea
-
 Kuwait
-
 Kyrgyzstan
-
 Laos
Laos
-
 Latvia
-
 Lebanon
-
 Lesotho
-
 Libya
Libya
-
 Lithuania
-
 Luxembourg
-
 Madagascar
-
 Malaysia
-
 Malta
Malta
-
 Mauritius
-
 Mexico
-
 Moldova
-
 Mongolia
-
 Montenegro
-
 Morocco
-
 Mozambique
-
 Myanmar
-
 Namibia
-
 Nepal
Nepal
-
 Netherlands
-
 New Zealand
-
 Nigeria
-
 North Macedonia
-
 Norway
-
 Oman
Oman
-
 Pakistan
-
 Palestine
-
 Panama
-
 Papua New Guinea
-
 Paraguay
-
 Peru
Peru
-
 Philippines
-
 Poland
-
 Portugal
-
 Puerto Rico
-
 Qatar
Qatar
-
 Reunion
-
 Romania
-
 Rwanda
-
 Saudi Arabia
-
 Serbia
-
 Singapore
-
 Slovakia
-
 Slovenia
-
 Somalia
-
 South Africa
-
 Spain
Spain
-
 Sri Lanka
-
 Sweden
-
 Switzerland
-
 Syria
Syria
-
 Taiwan
-
 Tajikistan
-
 Tanzania
-
 Thailand
-
 Trinidad and Tobago
-
 Tunisia
-
 Turkey
-
 UAE
UAE
-
 Uganda
-
 Ukraine
-
 United Kingdom
-
United States
-
 Uruguay
-
 Uzbekistan
-
 Venezuela
-
 Vietnam
-
 Yemen
Yemen
-
 Zambia
-
 Zimbabwe
- Forex
- Crypto












