
+3.48% for CME stock as futures launch expands U.S. trading options

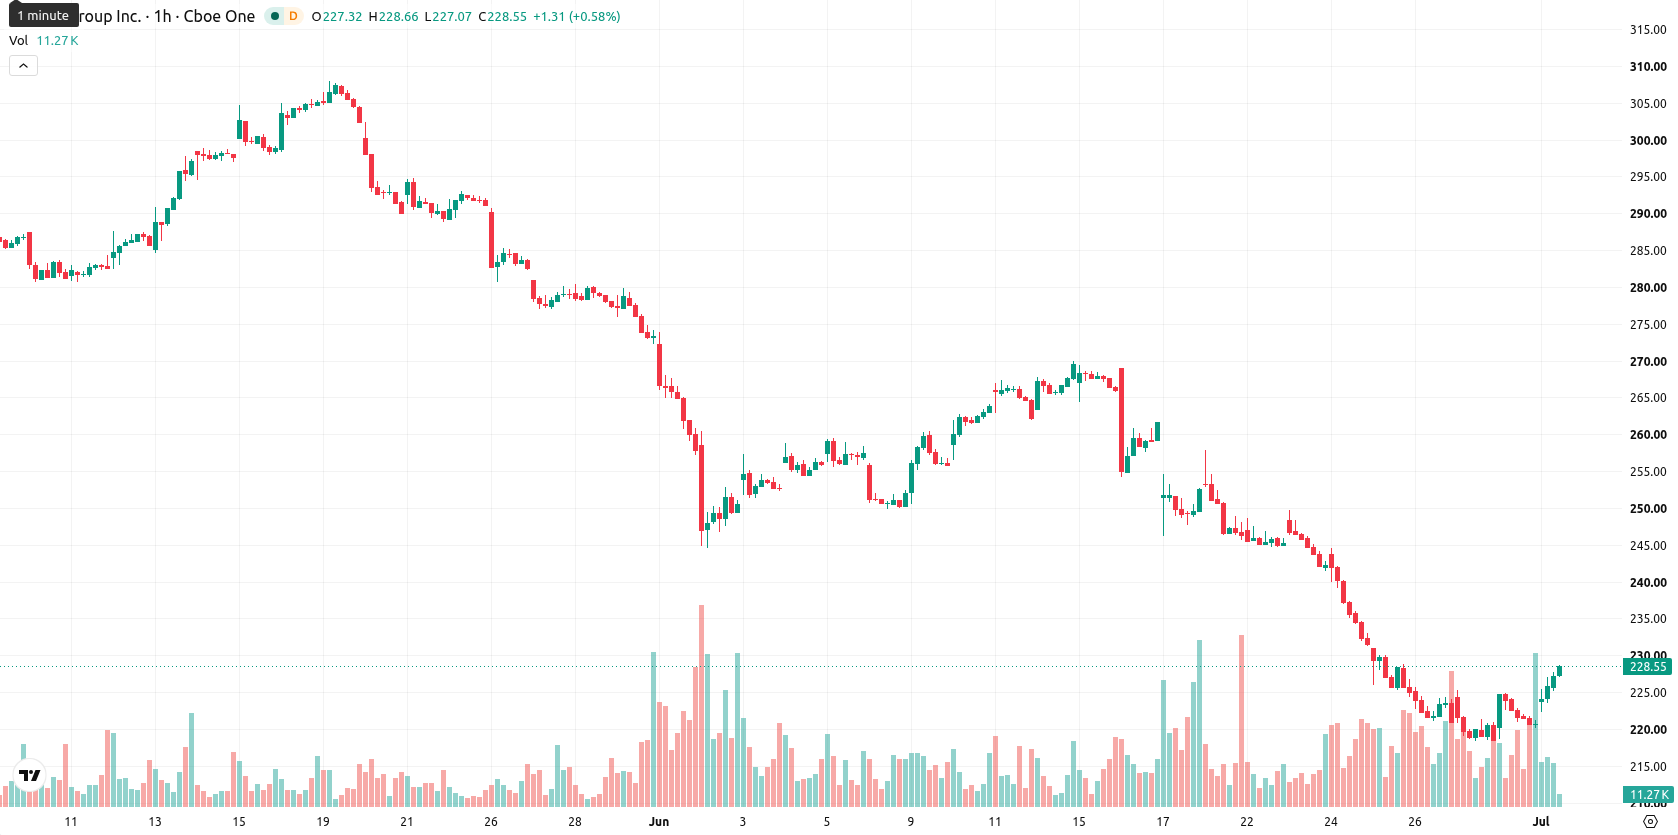
CME Group (CME) stock is trading at $228.51, up 3.48% for the session and near the session high. The price currently sits above its short-term moving averages but remains below medium- and long-term trend gauges.
Highlights
- CME Group is launching single-stock futures on over 50 major U.S. equities to broaden derivatives market participation.
- The rollout features 55 standard and 22 micro contracts, aiming to diversify revenue and boost platform trading activity.
- Technicals signal near-term consolidation between $222.69 and $234.33, with overbought momentum and downside risk outweighing bullish potential.
Derivatives expansion as CME targets broader participation and revenue growth
CME Group’s upcoming launch of single-stock futures covering over 50 leading U.S. stocks, as reported by Finance Yahoo, is expanding its derivatives offering with a focus on broadening market participation. The rollout, which includes 55 standard-sized contracts and 22 micro-sized contracts, is designed to enhance flexibility in managing equity exposure and attract new trading activity. The addition of these products provides fresh avenues for revenue growth and underscores CME’s drive to increase platform engagement and transactional volumes.
Momentum divergence as technical barriers and overbought conditions emerge
Technically, CME currently trades above the 20-day moving average ($222.25), with the 50-day at $229.93 acting as immediate overhead resistance and the 200-day at $280.48 defining longer-term bearish momentum. The Ichimoku Kijun level at $223.01 establishes a strong support zone. Among momentum signals, the Moving Average Convergence Divergence (MACD) indicates a strong sell, while the Average Directional Index (ADX) suggests a buy bias. The Relative Strength Index (RSI) stands at 56.52, highlighting modest buying momentum. However, both the Commodity Channel Index (CCI) and Stochastic RSI are overbought, mirrored by overbought readings in Bull/Bear Power, pointing to intraday buyer dominance and a short-term market stretch. The Awesome Oscillator is in strong buy territory, echoing the surge observed today, but the overall landscape is marked by divergence among momentum and oscillator readings.
Rangebound trading as bearish bias outweighs breakout potential
In the near term, CME is likely to consolidate within the $222.69 to $234.33 range, with a 59% probability of downside relative to upside potential at 41%. The baseline scenario is continued movement inside this volatility band. For a bullish outcome, CME would need a breakout above established resistance to initiate sustained gains. Conversely, slipping below the $223.01 support level could lead to an acceleration of further declines.
Earlier, analysts noted that CME Group was facing persistent bearish pressure with limited prospects for an imminent rebound. The current technical setup points to a mixed outlook and potential consolidation, making the $223.01 support level a key threshold to monitor for any renewed downside momentum.


-
 Afghanistan
-
 Albania
-
 Algeria
-
 Angola
-
 Argentina
-
 Armenia
-
 Australia
-
 Austria
-
 Azerbaijan
-
 Bahamas
-
 Bahrain
-
 Bangladesh
-
 Belarus
-
 Belgium
-
 Bolivia
-
 Botswana
-
 Brazil
-
 Brunei
-
 Bulgaria
-
 Cambodia
-
 Cameroon
-
 Canada
-
 Chile
Chile
-
 China
China
-
 Colombia
-
 Congo
Congo
-
 Costa Rica
-
 Cote d'Ivoire
-
 Croatia
-
 Cuba
Cuba
-
 Cyprus
-
 Czechia
-
 DR Congo
-
 Denmark
-
 Dominican Republic
-
 Ecuador
-
 Egypt
Egypt
-
 El Salvador
-
 Estonia
-
 Eswatini
-
 Ethiopia
-
 Finland
-
 France
-
 Georgia
-
 Germany
-
 Ghana
Ghana
-
 Greece
-
 Haiti
Haiti
-
 Hong Kong
-
 Hungary
-
 India
India
-
 Indonesia
-
 Iran, Islamic republic
-
 Iraq
Iraq
-
 Ireland
-
 Israel
-
 Italy
Italy
-
 Jamaica
-
 Japan
Japan
-
 Jordan
-
 Kazakhstan
-
 Kenya
Kenya
-
 Korea
Korea
-
 Kuwait
-
 Kyrgyzstan
-
 Laos
Laos
-
 Latvia
-
 Lebanon
-
 Lesotho
-
 Libya
Libya
-
 Lithuania
-
 Luxembourg
-
 Madagascar
-
 Malaysia
-
 Malta
Malta
-
 Mauritius
-
 Mexico
-
 Moldova
-
 Mongolia
-
 Montenegro
-
 Morocco
-
 Mozambique
-
 Myanmar
-
 Namibia
-
 Nepal
Nepal
-
 Netherlands
-
 New Zealand
-
 Nigeria
-
 North Macedonia
-
 Norway
-
 Oman
Oman
-
 Pakistan
-
 Palestine
-
 Panama
-
 Papua New Guinea
-
 Paraguay
-
 Peru
Peru
-
 Philippines
-
 Poland
-
 Portugal
-
 Puerto Rico
-
 Qatar
Qatar
-
 Reunion
-
 Romania
-
 Rwanda
-
 Saudi Arabia
-
 Serbia
-
 Singapore
-
 Slovakia
-
 Slovenia
-
 Somalia
-
 South Africa
-
 Spain
Spain
-
 Sri Lanka
-
 Sweden
-
 Switzerland
-
 Syria
Syria
-
 Taiwan
-
 Tajikistan
-
 Tanzania
-
 Thailand
-
 Trinidad and Tobago
-
 Tunisia
-
 Turkey
-
 UAE
UAE
-
 Uganda
-
 Ukraine
-
 United Kingdom
-
United States
-
 Uruguay
-
 Uzbekistan
-
 Venezuela
-
 Vietnam
-
 Yemen
Yemen
-
 Zambia
-
 Zimbabwe
- Forex
- Crypto
