

Applied Materials stock outlook: Bearish trend persists as sellers control near $347.52 support

Applied Materials (AMAT) stock is trading at $381.18, down 3.52% on the day. The price is currently below its short-term moving average and above its medium-term average, reflecting mixed positioning across key technical timeframes.
 381.37
404.40
Highlights
- ETFs purchased $317.1 million in Applied Materials stock, reversing the previous day's outflow and increasing institutional inflows.
- Shares of Applied Materials faced selling pressure and volatility ahead of next week's scheduled earnings release.
- Shares trade below short-term moving averages with bearish intraday momentum, expected to range between $347.52 to $414.84 over the next few days.
Institutional inflows offset by event risk amid sustained selling
On Monday, ETFs collectively purchased $317.1 million worth of Applied Materials shares in a move reversing the previous day's outflow, according to Gurufocus. This large-scale institutional inflow typically boosts demand and can provide a temporary floor for the stock, yet has coincided with continued selling pressure in today's session. Secondary context comes from heightened event risk ahead of next week's scheduled earnings release, which may be contributing to current market volatility, though price action has remained under broader selling pressure.
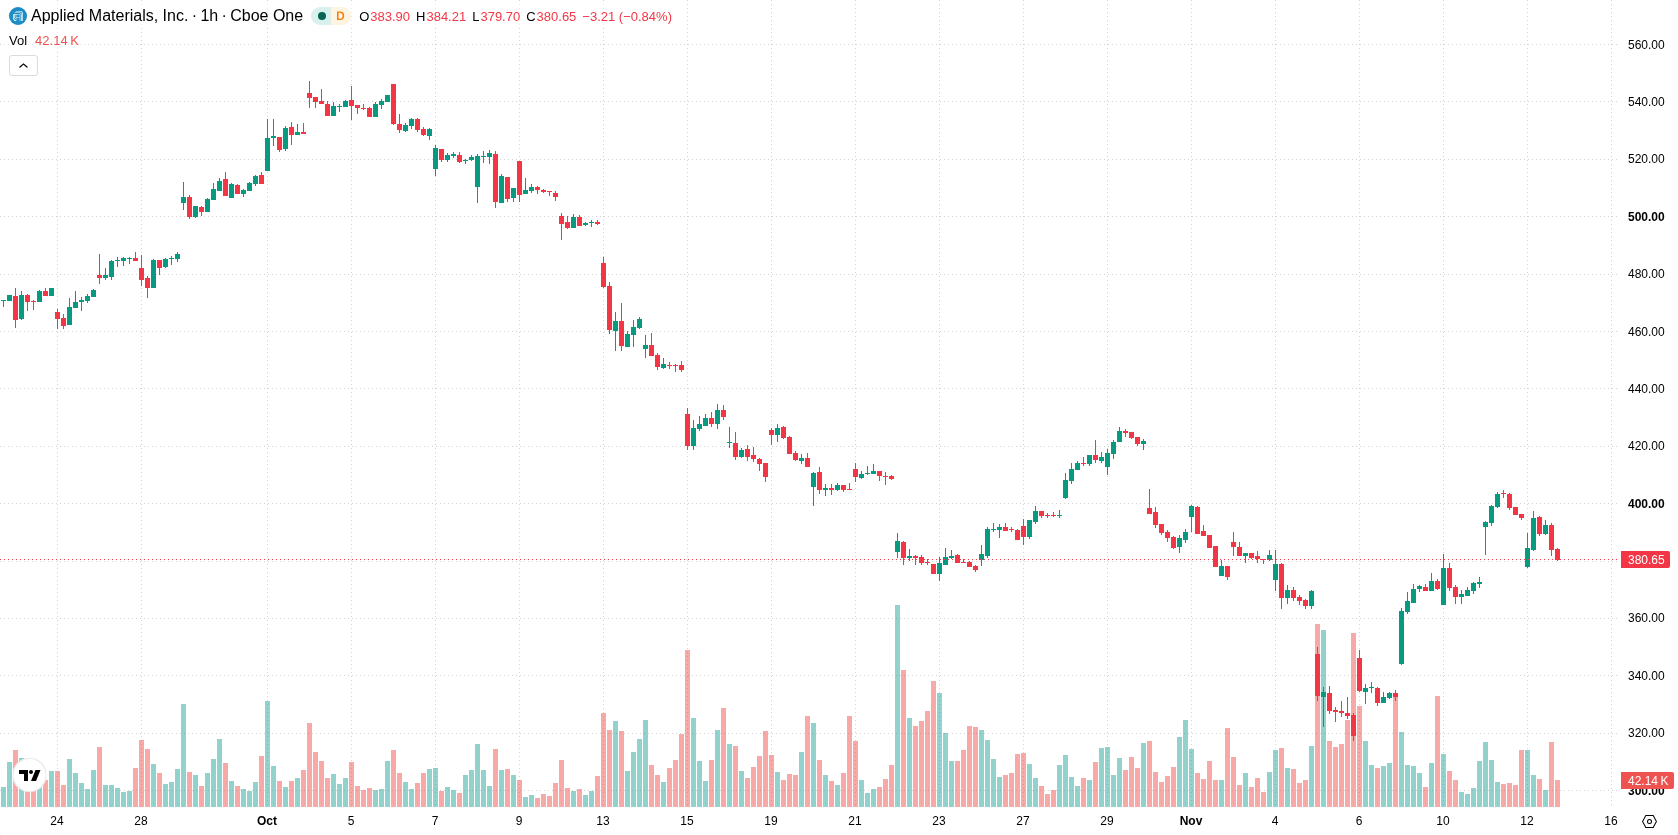
Bearish intraday bias as oversold signals clash with mixed momentum
On the hourly chart, AMAT is trading below its MA-20 but remains above its MA-50. However, on the daily timeframe, the price sits well beneath the MA-200. The Ichimoku Kijun line at $382.97 marks immediate resistance. MACD and ADX both indicate a bullish momentum setup, though oscillator signals are mixed: RSI and CCI are neutral, and the Stoch RSI is in oversold territory, potentially setting the stage for a short-term rebound. Bearish dominance is visible intraday, with Bull/Bear Power negative and price near the session's low after a wide, volatile move down 3.52% versus a previous close gap of 15.76. The Awesome Oscillator remains neutral, highlighting an environment where seller control is counterbalanced by mixed momentum signals and an oversold reading on Stoch RSI.
Downside favored as price consolidates within broad volatility band
Over the next two to three trading days, AMAT is expected to trade within a volatility band of $347.52 to $414.84. The probability scenario assigns a 45% chance to an upside move, while a downside move is favored at 55%. The baseline scenario points to sideways consolidation within this range. If the price decisively breaks above resistance, a bullish scenario could unfold, whereas a fall below support would reinforce the bearish outlook and open the door to further declines.
Earlier, analysts noted that Applied Materials had shifted to a more bullish technical setup amid strategic investment activity and positive momentum above key moving averages. The current environment, however, signals a change as the stock struggles below short-term resistance and faces continued selling pressure, making the next decisive move above $382.97 or below recent support a critical focus for traders.






Latest Applied Materials News




-
 Afghanistan
-
 Albania
-
 Algeria
-
 Angola
-
 Argentina
-
 Armenia
-
 Australia
-
 Austria
-
 Azerbaijan
-
 Bahamas
-
 Bahrain
-
 Bangladesh
-
 Belarus
-
 Belgium
-
 Bolivia
-
 Botswana
-
 Brazil
-
 Brunei
-
 Bulgaria
-
 Cambodia
-
 Cameroon
-
 Canada
-
 Chile
-
 China
-
 Colombia
-
 Congo
-
 Costa Rica
-
 Cote d'Ivoire
-
 Croatia
-
 Cuba
-
 Cyprus
-
 Czechia
-
 DR Congo
-
 Denmark
-
 Dominican Republic
-
 Ecuador
-
 Egypt
-
 El Salvador
-
 Estonia
-
 Eswatini
-
 Ethiopia
-
 Finland
-
 France
-
 Georgia
-
 Germany
-
 Ghana
-
 Greece
-
 Haiti
-
 Hong Kong
-
 Hungary
-
 India
-
 Indonesia
-
 Iran, Islamic republic
-
 Iraq
-
 Ireland
-
 Israel
-
 Italy
-
 Jamaica
-
 Japan
-
 Jordan
-
 Kazakhstan
-
 Kenya
-
 Korea
-
 Kuwait
-
 Kyrgyzstan
-
 Laos
-
 Latvia
-
 Lebanon
-
 Lesotho
-
 Libya
-
 Lithuania
-
 Luxembourg
-
 Madagascar
-
 Malaysia
-
 Malta
-
 Mauritius
-
 Mexico
-
 Moldova
-
 Mongolia
-
 Montenegro
-
 Morocco
-
 Mozambique
-
 Myanmar
-
 Namibia
-
 Nepal
-
 Netherlands
-
 New Zealand
-
 Nigeria
-
 North Macedonia
-
 Norway
-
 Oman
-
 Pakistan
-
 Palestine
-
 Panama
-
 Papua New Guinea
-
 Paraguay
-
 Peru
-
 Philippines
-
 Poland
-
 Portugal
-
 Puerto Rico
-
 Qatar
-
 Reunion
-
 Romania
-
 Rwanda
-
 Saudi Arabia
-
 Serbia
-
 Singapore
-
 Slovakia
-
 Slovenia
-
 Somalia
-
 South Africa
-
 Spain
-
 Sri Lanka
-
 Sweden
-
 Switzerland
-
 Syria
-
 Taiwan
-
 Tajikistan
-
 Tanzania
-
 Thailand
-
 Trinidad and Tobago
-
 Tunisia
-
 Turkey
-
 UAE
-
 Uganda
-
 Ukraine
-
 United Kingdom
-
United States
-
 Uruguay
-
 Uzbekistan
-
 Venezuela
-
 Vietnam
-
 Yemen
-
 Zambia
-
 Zimbabwe
- Forex
- Crypto












