
Curve: intraday strength led to 7.69% gain despite bearish weekly price prediction

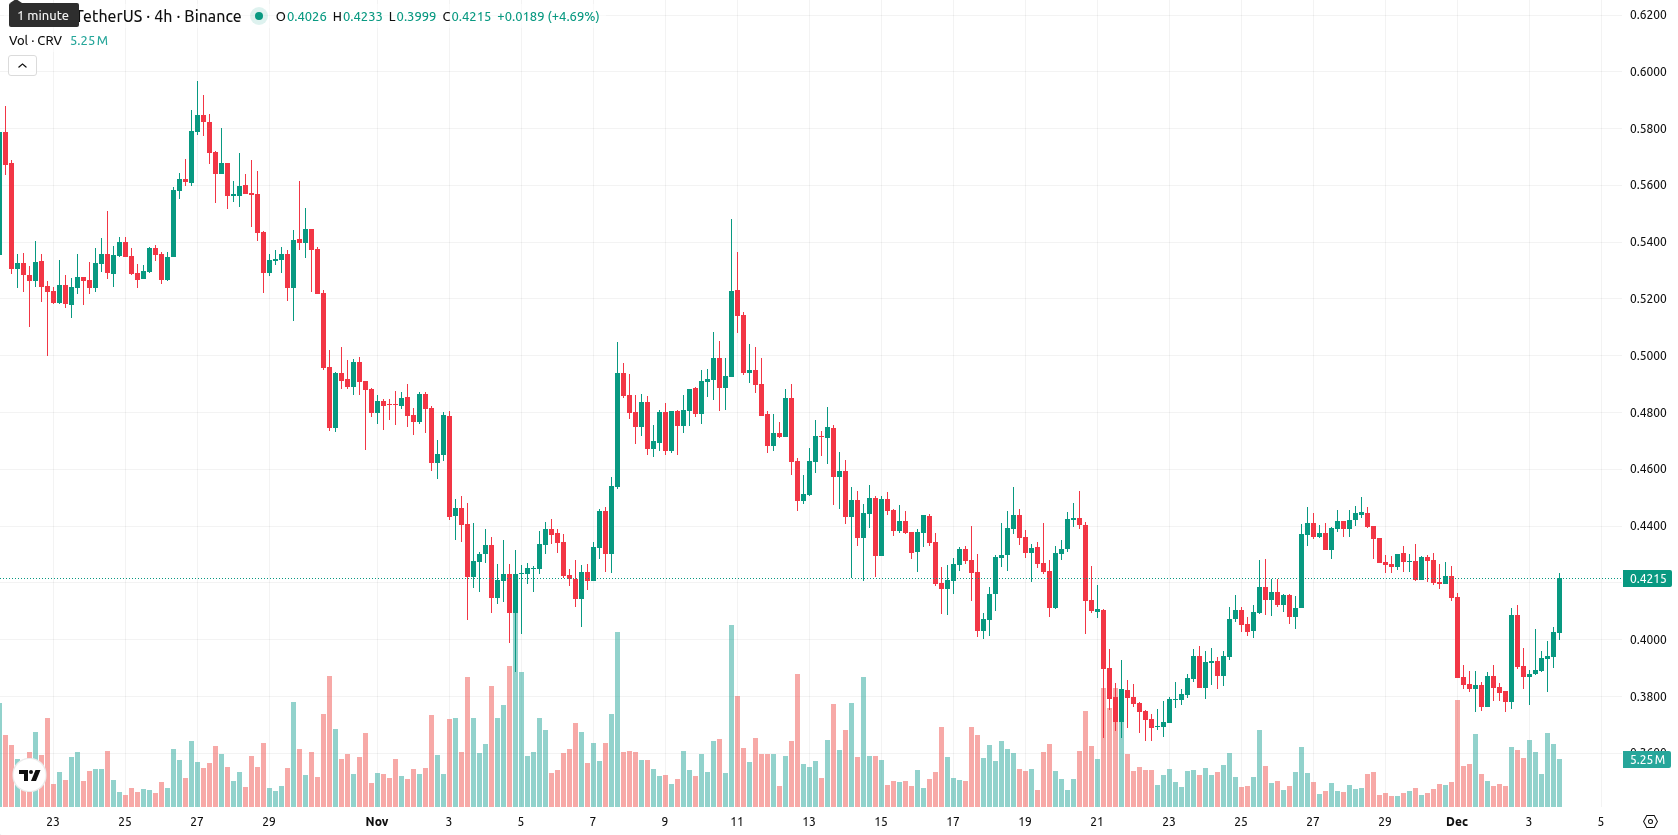
Curve (CRV) is trading at $0.4214, currently above the short-term MA-20 ($0.4152) but below both the medium-term MA-50 ($0.4704) and long-term MA-200 ($0.6796). This configuration signals recent short-term buying support, while the broader medium- and long-term trends remain bearish; the next dynamic resistance sits at the Ichimoku Kijun level of $0.4560, with support near the MA-20.
 0.2135
0.2303
0.2135
0.2303
Highlights
- Curve DAO Token reported a 24-hour trading volume of $140.85 million and a total market capitalization of $555.55 million.
- Curve's platform continues to attract liquidity providers by offering low-slippage, low-fee stablecoin trading and additional fee income through its liquidity pools.
- These metrics reinforce Curve's current positioning and operational strength within the DeFi sector on the Ethereum network.
Stable DeFi positioning amid high market activity and liquidity flows
Curve DAO Token operates on the Ethereum network and is recognized for its stablecoin trading platform offering low-slippage and low-fee transactions, along with additional fee income to liquidity providers via its liquidity pools. Over a recent 24-hour period, the token's trading volume reached $140.85 million, and the total market capitalization was reported at $555.55 million. These operational characteristics continue to define Curve's positioning within the DeFi sector.
Sellers' dominance persists as intraday buyers test bearish signals
Momentum signals on the daily chart remain largely bearish, with MACD showing strong downside pressure and ADX indicating a weak, trendless environment. Most oscillators (RSI at 38.92, CCI at –96.87) suggest the market is not oversold yet but generally points to sellers’ dominance, reinforced by a negative BBP reading. The daily session saw a strong 7.69% advance to $0.4214, with no meaningful gap between previous close and today’s open and the price finishing near the top end of today’s range, reflecting high intraday volatility and strength toward the highs. Notably, while daily momentum favors sellers, the intraday tone and oscillators diverge, showing buyers reemerging in the short run despite the prevailing bearish bias.
Range-bound outlook prevails as downside pressure dominates weekly signals
Over the next week, expect CRV to trade between $0.3800 and $0.4550, normalized to reflect the current price and historical volatility. There is a very low probability (less than 20%) of a sustained upside, as all key weekly indicators (MA, RSI, MACD, ADX) favor further downside and suggest the likelihood of a bearish move outweighs the chance of a rebound. The baseline scenario is for range-bound price action between $0.3800 and $0.4550 — a bullish move would require a decisive breakout above $0.4560, while a close below $0.3800 could accelerate further declines toward deeper support.
Previously it was reported that Curve continued to trade below all key moving averages, as sellers maintained control and technical indicators such as MACD, ADX, and RSI signaled prevailing bearish momentum near oversold conditions. Analysts noted that resistance levels capped upside potential while increased volatility and subdued trend strength combined to keep the price confined within a narrow range, with a persistent bearish outlook dominating short-term scenarios.







-
 Afghanistan
-
 Albania
-
 Algeria
-
 Angola
-
 Argentina
-
 Armenia
-
 Australia
-
 Austria
-
 Azerbaijan
-
 Bahamas
-
 Bahrain
-
 Bangladesh
-
 Belarus
-
 Belgium
-
 Bolivia
-
 Botswana
-
 Brazil
-
 Brunei
-
 Bulgaria
-
 Cambodia
-
 Cameroon
-
 Canada
-
 Chile
Chile
-
 China
China
-
 Colombia
-
 Congo
Congo
-
 Costa Rica
-
 Cote d'Ivoire
-
 Croatia
-
 Cuba
Cuba
-
 Cyprus
-
 Czechia
-
 DR Congo
-
 Denmark
-
 Dominican Republic
-
 Ecuador
-
 Egypt
Egypt
-
 El Salvador
-
 Estonia
-
 Eswatini
-
 Ethiopia
-
 Finland
-
 France
-
 Georgia
-
 Germany
-
 Ghana
Ghana
-
 Greece
-
 Haiti
Haiti
-
 Hong Kong
-
 Hungary
-
 India
India
-
 Indonesia
-
 Iran, Islamic republic
-
 Iraq
Iraq
-
 Ireland
-
 Israel
-
 Italy
Italy
-
 Jamaica
-
 Japan
Japan
-
 Jordan
-
 Kazakhstan
-
 Kenya
Kenya
-
 Korea
Korea
-
 Kuwait
-
 Kyrgyzstan
-
 Laos
Laos
-
 Latvia
-
 Lebanon
-
 Lesotho
-
 Libya
Libya
-
 Lithuania
-
 Luxembourg
-
 Madagascar
-
 Malaysia
-
 Malta
Malta
-
 Mauritius
-
 Mexico
-
 Moldova
-
 Mongolia
-
 Montenegro
-
 Morocco
-
 Mozambique
-
 Myanmar
-
 Namibia
-
 Nepal
Nepal
-
 Netherlands
-
 New Zealand
-
 Nigeria
-
 North Macedonia
-
 Norway
-
 Oman
Oman
-
 Pakistan
-
 Palestine
-
 Panama
-
 Papua New Guinea
-
 Paraguay
-
 Peru
Peru
-
 Philippines
-
 Poland
-
 Portugal
-
 Puerto Rico
-
 Qatar
Qatar
-
 Reunion
-
 Romania
-
 Rwanda
-
 Saudi Arabia
-
 Serbia
-
 Singapore
-
 Slovakia
-
 Slovenia
-
 Somalia
-
 South Africa
-
 Spain
Spain
-
 Sri Lanka
-
 Sweden
-
 Switzerland
-
 Syria
Syria
-
 Taiwan
-
 Tajikistan
-
 Tanzania
-
 Thailand
-
 Trinidad and Tobago
-
 Tunisia
-
 Turkey
-
 UAE
UAE
-
 Uganda
-
 Ukraine
-
 United Kingdom
-
United States
-
 Uruguay
-
 Uzbekistan
-
 Venezuela
-
 Vietnam
-
 Yemen
Yemen
-
 Zambia
-
 Zimbabwe
- Forex
- Crypto











