
NEAR news live: forecast favors further declines — resistance capped at $1.93

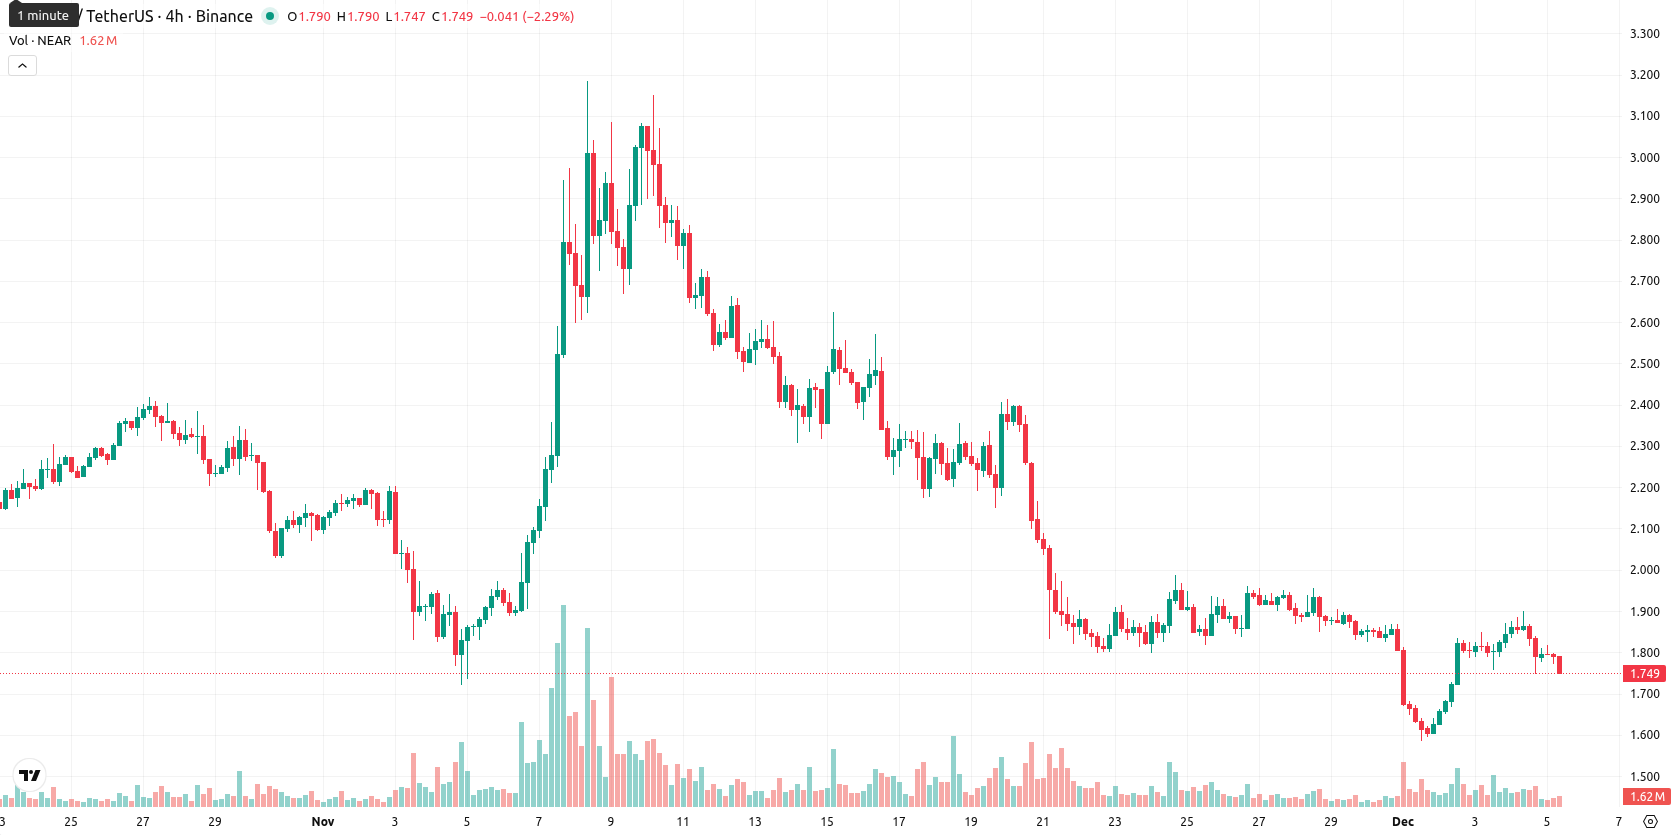
NEAR is trading at $1.754, remaining below the MA-20 ($1.9745), MA-50 ($2.1735), and MA-200 ($2.4809), which maintains a bearish structure across short-, medium-, and long-term trends. The nearest dynamic resistance is seen at the Ichimoku Kijun level ($2.3670), while immediate support is shaped by recent lows just beneath the current price.
 2.108
2.0660
2.108
2.0660
Highlights
- NEAR is trading at $1.754, remaining below its MA-20 ($1.9745), MA-50 ($2.1735), and MA-200 ($2.4809), signaling continued bearish trends across all timeframes.
- Momentum indicators show weakness—MACD issues a strong sell, ADX signals lack of trend strength, RSI and CCI both indicate sell conditions, and intraday volatility is high as the price nears session lows.
- The expected five-day range for NEAR is $1.55–$1.93, with less than 20% probability of a price increase and higher likelihood of continued downside.
Momentum weakens further amid high volatility and mixed oscillators
Momentum signals remain weak with MACD showing a strong sell and ADX indicating a lack of clear directional strength. The RSI and CCI are both in sell territory, and Stochastic RSI suggests overbought conditions on the daily chart while shorter timeframes report oversold, signaling a divergence in momentum. BBP is just above zero and forecasts a buy, pointing to very mild buyer pressure intraday, but the awesome oscillator reinforces the prevailing bearish tone. The session opened slightly below the previous close, reflecting a modest gap, and the current price is near the session low of $1.771, indicating high intraday volatility and sustained downward pressure after the open. Despite some mixed oscillator readings, price action and primary momentum indicators currently favor sellers.
Sideways move likely as sellers dominate and upside risks diminish
For the next five trading days, the expected range for NEAR is adjusted to $1.55 – $1.93, keeping within 10% of the current price to reflect typical volatility. The probability of a price increase is very low (less than 20%), making further decreases much more likely. Baseline scenario: NEAR moves sideways between $1.55 and $1.93 as sellers stay active but no new impulse appears. Bullish scenario: the price breaks above resistance at $1.93, potentially testing the $2.00 area if momentum improves. Bearish scenario: a drop below $1.55 could open the way toward further declines, as downward momentum and technical pressure persist.
Previously it was reported that NEAR Protocol remained under pressure, trading below major moving averages with technical indicators such as the MACD and ADX reflecting continued selling momentum and a weak underlying trend. Oscillators including the RSI and Stoch RSI highlighted oversold conditions and ongoing attempts to rebound, while the nearest resistance was capped near the daily Ichimoku Kijun as buyers regained some initiative but overall signals retained a bearish bias.


Latest NEAR News







-
 Afghanistan
-
 Albania
-
 Algeria
-
 Angola
-
 Argentina
-
 Armenia
-
 Australia
-
 Austria
-
 Azerbaijan
-
 Bahamas
-
 Bahrain
-
 Bangladesh
-
 Belarus
-
 Belgium
-
 Bolivia
-
 Botswana
-
 Brazil
-
 Brunei
-
 Bulgaria
-
 Cambodia
-
 Cameroon
-
 Canada
-
 Chile
Chile
-
 China
China
-
 Colombia
-
 Congo
Congo
-
 Costa Rica
-
 Cote d'Ivoire
-
 Croatia
-
 Cuba
Cuba
-
 Cyprus
-
 Czechia
-
 DR Congo
-
 Denmark
-
 Dominican Republic
-
 Ecuador
-
 Egypt
Egypt
-
 El Salvador
-
 Estonia
-
 Eswatini
-
 Ethiopia
-
 Finland
-
 France
-
 Georgia
-
 Germany
-
 Ghana
Ghana
-
 Greece
-
 Haiti
Haiti
-
 Hong Kong
-
 Hungary
-
 India
India
-
 Indonesia
-
 Iran, Islamic republic
-
 Iraq
Iraq
-
 Ireland
-
 Israel
-
 Italy
Italy
-
 Jamaica
-
 Japan
Japan
-
 Jordan
-
 Kazakhstan
-
 Kenya
Kenya
-
 Korea
Korea
-
 Kuwait
-
 Kyrgyzstan
-
 Laos
Laos
-
 Latvia
-
 Lebanon
-
 Lesotho
-
 Libya
Libya
-
 Lithuania
-
 Luxembourg
-
 Madagascar
-
 Malaysia
-
 Malta
Malta
-
 Mauritius
-
 Mexico
-
 Moldova
-
 Mongolia
-
 Montenegro
-
 Morocco
-
 Mozambique
-
 Myanmar
-
 Namibia
-
 Nepal
Nepal
-
 Netherlands
-
 New Zealand
-
 Nigeria
-
 North Macedonia
-
 Norway
-
 Oman
Oman
-
 Pakistan
-
 Palestine
-
 Panama
-
 Papua New Guinea
-
 Paraguay
-
 Peru
Peru
-
 Philippines
-
 Poland
-
 Portugal
-
 Puerto Rico
-
 Qatar
Qatar
-
 Reunion
-
 Romania
-
 Rwanda
-
 Saudi Arabia
-
 Serbia
-
 Singapore
-
 Slovakia
-
 Slovenia
-
 Somalia
-
 South Africa
-
 Spain
Spain
-
 Sri Lanka
-
 Sweden
-
 Switzerland
-
 Syria
Syria
-
 Taiwan
-
 Tajikistan
-
 Tanzania
-
 Thailand
-
 Trinidad and Tobago
-
 Tunisia
-
 Turkey
-
 UAE
UAE
-
 Uganda
-
 Ukraine
-
 United Kingdom
-
United States
-
 Uruguay
-
 Uzbekistan
-
 Venezuela
-
 Vietnam
-
 Yemen
Yemen
-
 Zambia
-
 Zimbabwe
- Forex
- Crypto











