
Jupiter: persistent downside momentum led to a 7.2% daily price drop

Jupiter (JUP) is trading at $0.2255 after a sharp daily decline, reflecting a move well below its MA-20 ($0.2495), MA-50 ($0.3195), and MA-200 ($0.4438). This positions the asset firmly beneath all major trend indicators and highlights persistent downside momentum in both the short and long term.
 0.203
0.2176
0.203
0.2176
Highlights
- JUP is trading at $0.2255, below its MA-20 ($0.2495), MA-50 ($0.3195), and MA-200 ($0.4438), signaling pronounced bearish momentum across all timeframes.
- Momentum indicators including the MACD, ADX, and Bull/Bear Power confirm strong selling pressure, with RSI at 33.44 and CCI showing oversold conditions.
- JUP's price is expected to consolidate between $0.200 and $0.250 this week, with an 80% probability of further decline unless resistance at $0.296 is breached.
Strong sell signals as momentum and volatility drive bearish bias
Momentum is negative, with the MACD showing a strong sell and the ADX indicating a firm downtrend on the daily chart. RSI is slipping into oversold territory (33.44), CCI shows oversold conditions, and Stochastic RSI is neutral but leans oversold in several intraday spots. Bull/Bear Power also confirms sellers are in control, with a Sell bias and negative value. The nearest Ichimoku dynamic resistance (Kijun) is at $0.2961, and the price is trading tightly near today's lows with high intraday volatility and continued downward pressure.
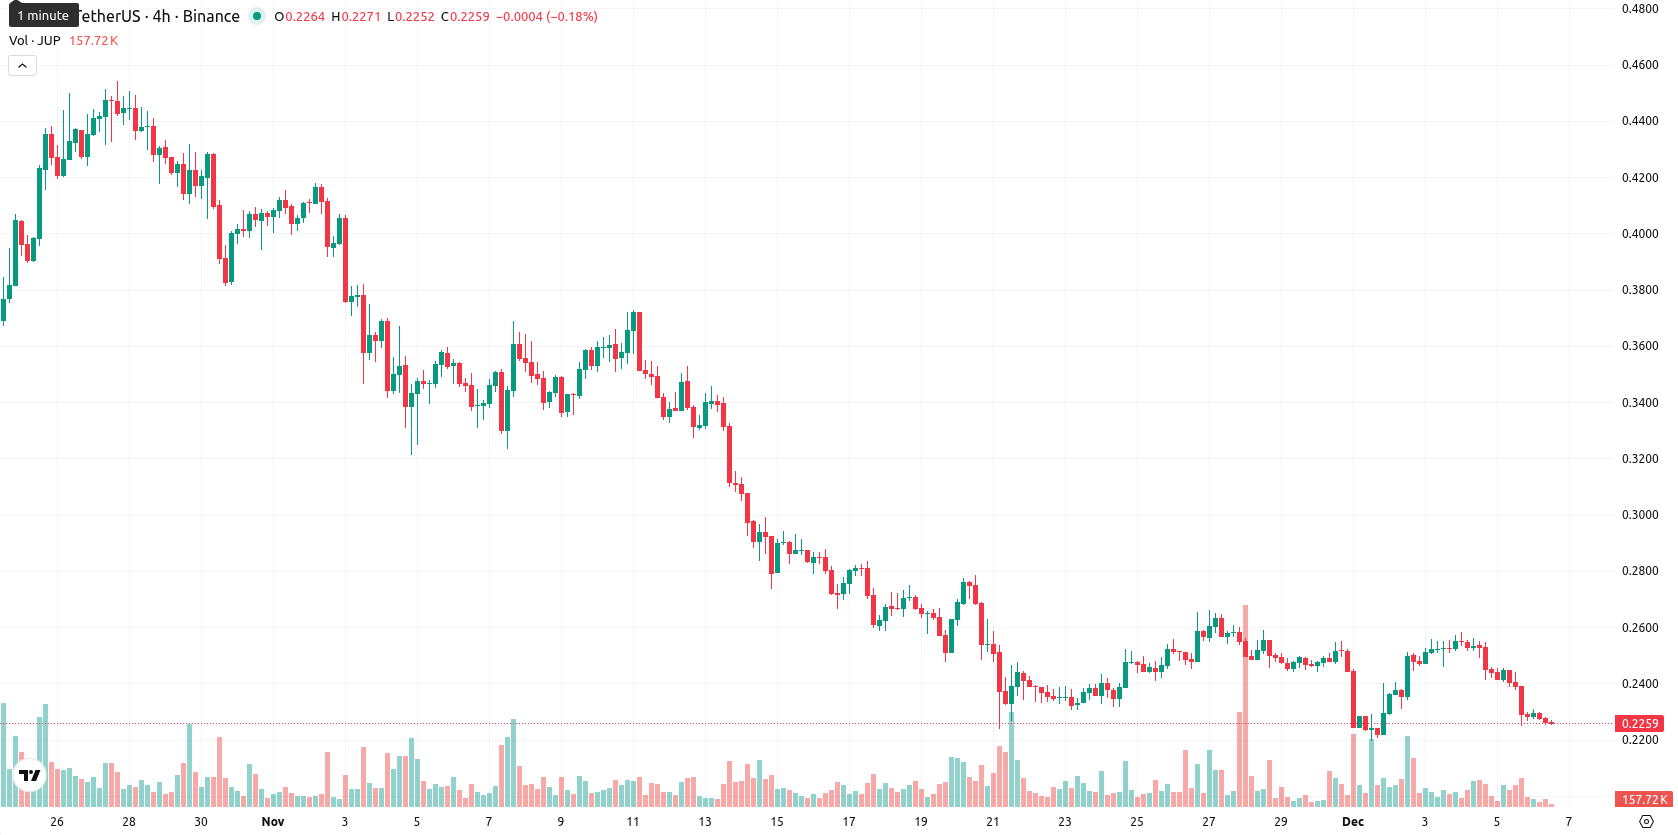
High probability of further losses amid fragile support zone
For the coming week, typical volatility points to a range between $0.200 and $0.250, matching present trading levels and market activity. There is a very high probability (over 80%) of continued decline, with a rebound less likely unless resistance at $0.296 is reclaimed. The baseline short-term scenario favors sideways consolidation within the current band, but if the $0.22 – $0.20 support zone breaks, a further slide remains the dominant risk.
Last time, analysts noted that Jupiter was facing persistent bearish momentum as it traded well below its key moving averages, with strong downward pressure confirmed by both MACD and ADX indicators. Mixed oscillator readings signaled potential exhaustion in the selloff, while volatility and resistance near the Ichimoku Kijun level suggested an unstable and negative intraday tone in the session has seen ongoing pressure.








-
 Afghanistan
-
 Albania
-
 Algeria
-
 Angola
-
 Argentina
-
 Armenia
-
 Australia
-
 Austria
-
 Azerbaijan
-
 Bahamas
-
 Bahrain
-
 Bangladesh
-
 Belarus
-
 Belgium
-
 Bolivia
-
 Botswana
-
 Brazil
-
 Brunei
-
 Bulgaria
-
 Cambodia
-
 Cameroon
-
 Canada
-
 Chile
Chile
-
 China
China
-
 Colombia
-
 Congo
Congo
-
 Costa Rica
-
 Cote d'Ivoire
-
 Croatia
-
 Cuba
Cuba
-
 Cyprus
-
 Czechia
-
 DR Congo
-
 Denmark
-
 Dominican Republic
-
 Ecuador
-
 Egypt
Egypt
-
 El Salvador
-
 Estonia
-
 Eswatini
-
 Ethiopia
-
 Finland
-
 France
-
 Georgia
-
 Germany
-
 Ghana
Ghana
-
 Greece
-
 Haiti
Haiti
-
 Hong Kong
-
 Hungary
-
 India
India
-
 Indonesia
-
 Iran, Islamic republic
-
 Iraq
Iraq
-
 Ireland
-
 Israel
-
 Italy
Italy
-
 Jamaica
-
 Japan
Japan
-
 Jordan
-
 Kazakhstan
-
 Kenya
Kenya
-
 Korea
Korea
-
 Kuwait
-
 Kyrgyzstan
-
 Laos
Laos
-
 Latvia
-
 Lebanon
-
 Lesotho
-
 Libya
Libya
-
 Lithuania
-
 Luxembourg
-
 Madagascar
-
 Malaysia
-
 Malta
Malta
-
 Mauritius
-
 Mexico
-
 Moldova
-
 Mongolia
-
 Montenegro
-
 Morocco
-
 Mozambique
-
 Myanmar
-
 Namibia
-
 Nepal
Nepal
-
 Netherlands
-
 New Zealand
-
 Nigeria
-
 North Macedonia
-
 Norway
-
 Oman
Oman
-
 Pakistan
-
 Palestine
-
 Panama
-
 Papua New Guinea
-
 Paraguay
-
 Peru
Peru
-
 Philippines
-
 Poland
-
 Portugal
-
 Puerto Rico
-
 Qatar
Qatar
-
 Reunion
-
 Romania
-
 Rwanda
-
 Saudi Arabia
-
 Serbia
-
 Singapore
-
 Slovakia
-
 Slovenia
-
 Somalia
-
 South Africa
-
 Spain
Spain
-
 Sri Lanka
-
 Sweden
-
 Switzerland
-
 Syria
Syria
-
 Taiwan
-
 Tajikistan
-
 Tanzania
-
 Thailand
-
 Trinidad and Tobago
-
 Tunisia
-
 Turkey
-
 UAE
UAE
-
 Uganda
-
 Ukraine
-
 United Kingdom
-
United States
-
 Uruguay
-
 Uzbekistan
-
 Venezuela
-
 Vietnam
-
 Yemen
Yemen
-
 Zambia
-
 Zimbabwe
- Forex
- Crypto











