
Strong oversold signals — ApeCoin gains 7.64% amid persistent bearish pressure

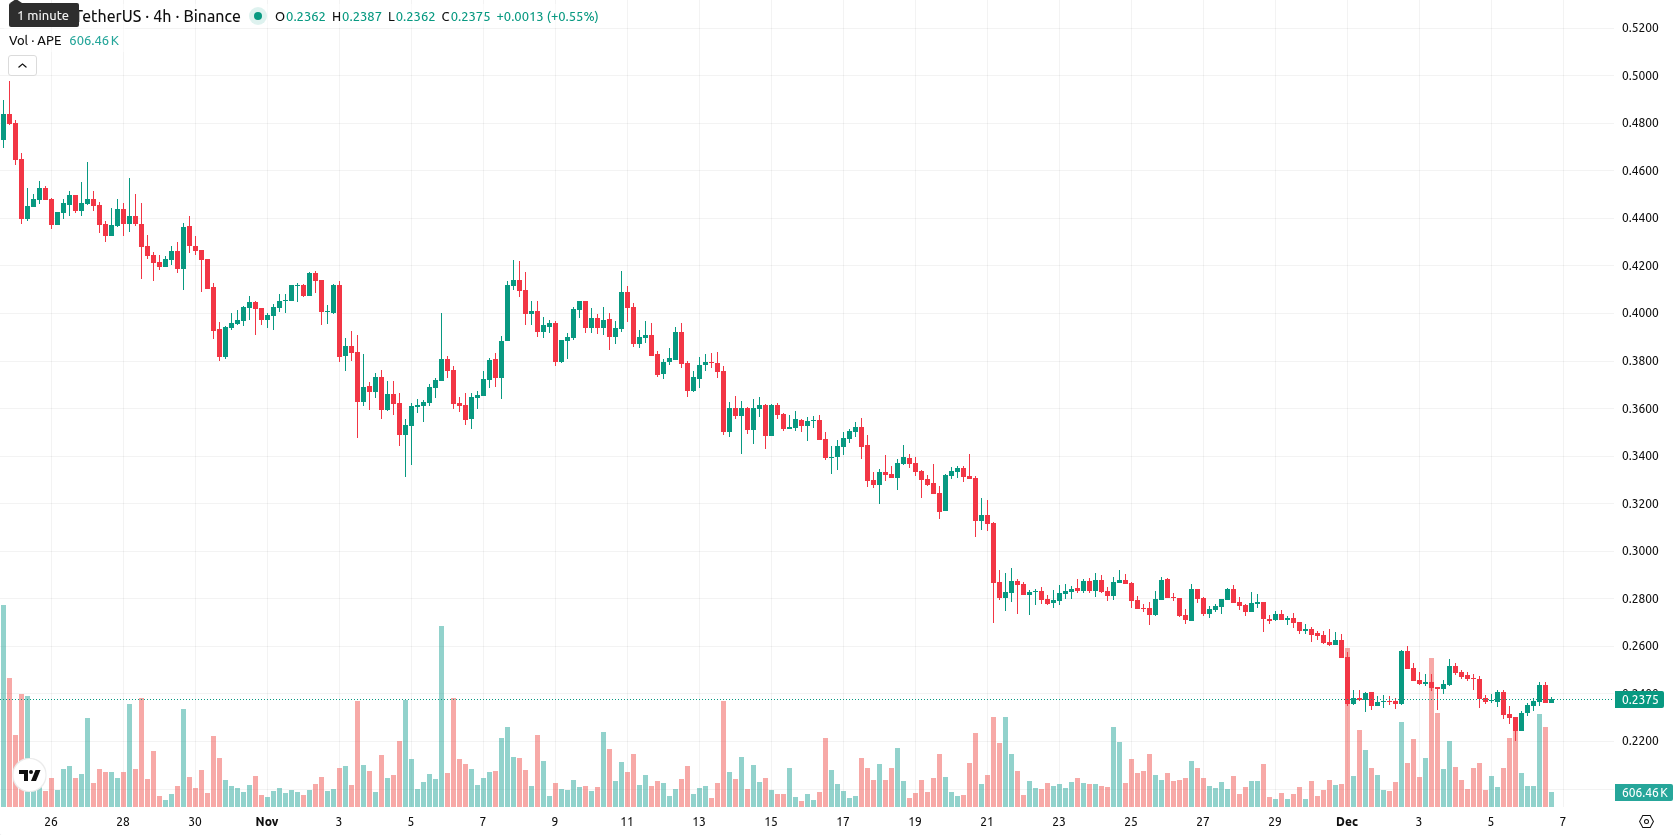
ApeCoin (APE) is trading at $0.238 and remains below MA-20 ($0.2818), MA-50 ($0.3520), and MA-200 ($0.5439), signaling persistent bearish pressure in the short, medium, and long term. The nearest dynamic resistance is the Ichimoku Kijun level at $0.3182, while immediate support is likely to align with the lower end of today’s trading range.
Highlights
- APE trades at $0.238, remaining below MA-20 ($0.2818), MA-50 ($0.3520), and MA-200 ($0.5439), signaling persistent bearish pressure across all timeframes.
- Momentum and trend indicators including MACD, ADX, and RSI (at 26.67) confirm strong selling pressure and an oversold environment despite a 7.64% intraday price rise.
- Baseline scenario expects APE to trade sideways between $0.215 and $0.255 over the next five days, with less than 20% probability of a sustained price increase.
Momentum divergence emerges as relief rally faces strong resistance
Momentum indicators show continued bearishness, with MACD and ADX both pointing to selling pressure. Oscillators confirm a strongly oversold environment: RSI sits at 26.67 and Commodity Channel Index is at –129.99, while Stoch RSI is also low, reflecting persistent weakness but warning of potential exhaustion in the downtrend. Bull/Bear Power remains negative (–0.0221), indicating sellers remain dominant intraday, although today’s price rose 7.64% from the previous close with no price gap at the open. The current price is near the midpoint of today’s range, with high intraday volatility and evidence of sideways consolidation following the initial strength after the open. Despite the daily bounce, most momentum and trend signals remain bearish, and oscillators highlight divergence as the relief rally faces strong resistance overhead.
Downside risk dominates as weekly signals reinforce lower outlook
For the next five trading days, the expected price range is from $0.215 to $0.255, normalized around the current price to reflect recent volatility. All key weekly indicators — RSI, ADX, MACD, and MA-50 — signal a sell, confirming a very low probability (less than 20%) of a sustained price increase and making further downside more likely. In the baseline scenario, APE is likely to trade sideways between $0.215 and $0.255 as selling pressure is balanced by short-term oversold conditions. A bullish scenario would require a breakout above the Kijun resistance around $0.3182, which appears unlikely in the current environment. Conversely, a bearish scenario could see a renewed decline toward $0.215 or below if sellers regain full control and break the lower end of the short-term range.
Previously it was reported that ApeCoin continued to trade notably below its short-, medium-, and long-term moving averages, with momentum indicators such as MACD and ADX reinforcing a strong sell bias and RSI confirming an oversold setup. Sellers retained control as downside momentum persisted, and the nearest dynamic resistance remained at the Ichimoku Kijun level, while price action reflected high volatility and a sharp loss on the day with no significant recovery attempts observed.


-
 Afghanistan
-
 Albania
-
 Algeria
-
 Angola
-
 Argentina
-
 Armenia
-
 Australia
-
 Austria
-
 Azerbaijan
-
 Bahamas
-
 Bahrain
-
 Bangladesh
-
 Belarus
-
 Belgium
-
 Bolivia
-
 Botswana
-
 Brazil
-
 Brunei
-
 Bulgaria
-
 Cambodia
-
 Cameroon
-
 Canada
-
 Chile
Chile
-
 China
China
-
 Colombia
-
 Congo
Congo
-
 Costa Rica
-
 Cote d'Ivoire
-
 Croatia
-
 Cuba
Cuba
-
 Cyprus
-
 Czechia
-
 DR Congo
-
 Denmark
-
 Dominican Republic
-
 Ecuador
-
 Egypt
Egypt
-
 El Salvador
-
 Estonia
-
 Eswatini
-
 Ethiopia
-
 Finland
-
 France
-
 Georgia
-
 Germany
-
 Ghana
Ghana
-
 Greece
-
 Haiti
Haiti
-
 Hong Kong
-
 Hungary
-
 India
India
-
 Indonesia
-
 Iran, Islamic republic
-
 Iraq
Iraq
-
 Ireland
-
 Israel
-
 Italy
Italy
-
 Jamaica
-
 Japan
Japan
-
 Jordan
-
 Kazakhstan
-
 Kenya
Kenya
-
 Korea
Korea
-
 Kuwait
-
 Kyrgyzstan
-
 Laos
Laos
-
 Latvia
-
 Lebanon
-
 Lesotho
-
 Libya
Libya
-
 Lithuania
-
 Luxembourg
-
 Madagascar
-
 Malaysia
-
 Malta
Malta
-
 Mauritius
-
 Mexico
-
 Moldova
-
 Mongolia
-
 Montenegro
-
 Morocco
-
 Mozambique
-
 Myanmar
-
 Namibia
-
 Nepal
Nepal
-
 Netherlands
-
 New Zealand
-
 Nigeria
-
 North Macedonia
-
 Norway
-
 Oman
Oman
-
 Pakistan
-
 Palestine
-
 Panama
-
 Papua New Guinea
-
 Paraguay
-
 Peru
Peru
-
 Philippines
-
 Poland
-
 Portugal
-
 Puerto Rico
-
 Qatar
Qatar
-
 Reunion
-
 Romania
-
 Rwanda
-
 Saudi Arabia
-
 Serbia
-
 Singapore
-
 Slovakia
-
 Slovenia
-
 Somalia
-
 South Africa
-
 Spain
Spain
-
 Sri Lanka
-
 Sweden
-
 Switzerland
-
 Syria
Syria
-
 Taiwan
-
 Tajikistan
-
 Tanzania
-
 Thailand
-
 Trinidad and Tobago
-
 Tunisia
-
 Turkey
-
 UAE
UAE
-
 Uganda
-
 Ukraine
-
 United Kingdom
-
United States
-
 Uruguay
-
 Uzbekistan
-
 Venezuela
-
 Vietnam
-
 Yemen
Yemen
-
 Zambia
-
 Zimbabwe
- Forex
- Crypto
