
NEAR news live: price rallies yet risk remains high with unanimous sell signals on weekly chart

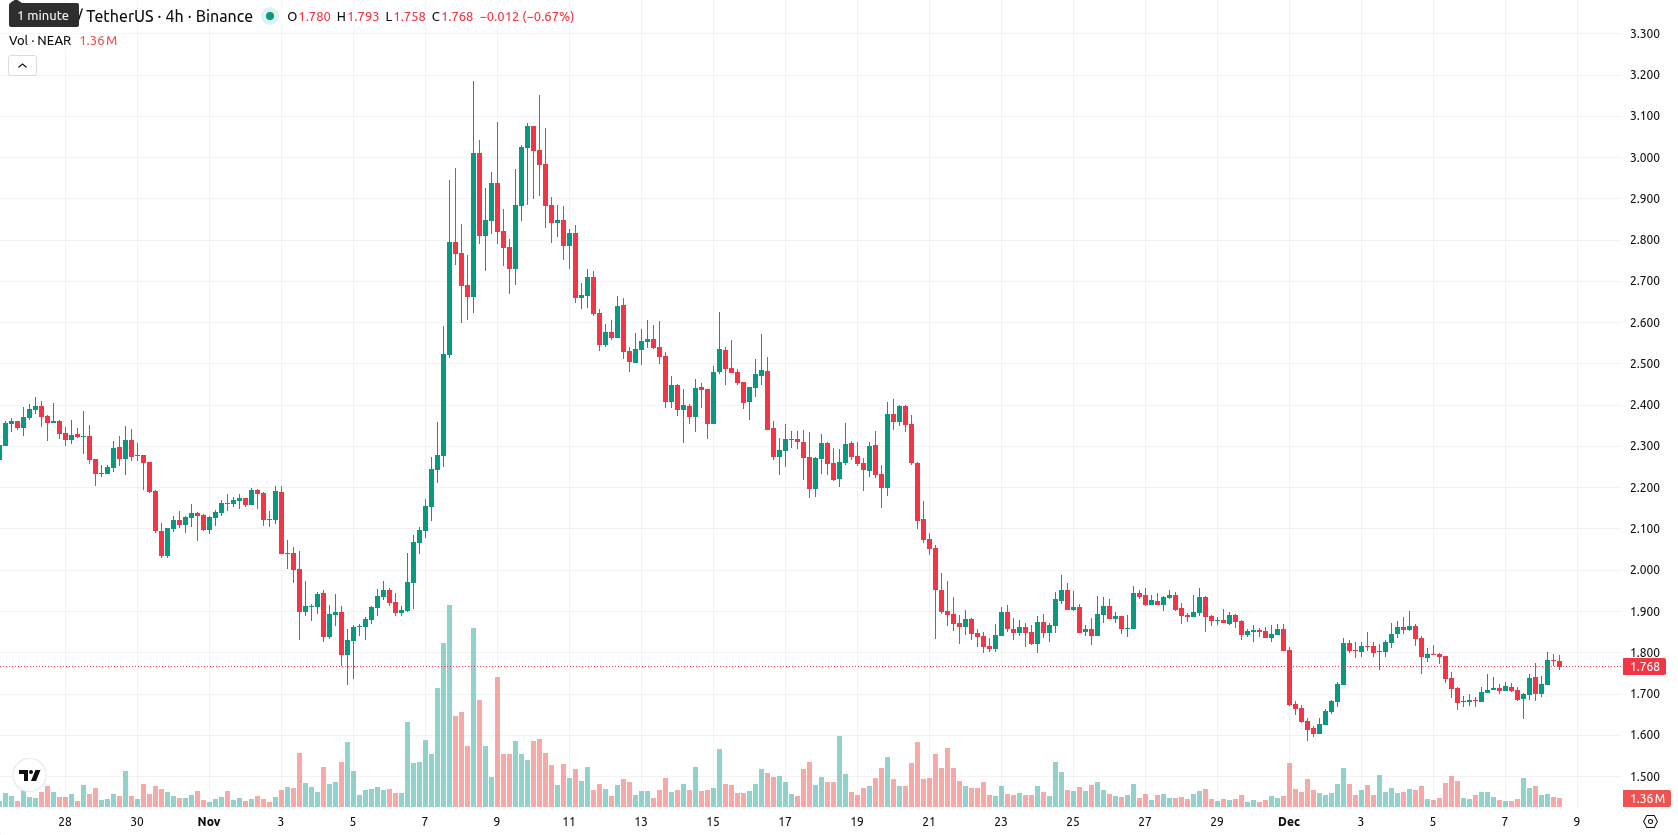
NEAR is currently trading at $1.777, sitting below key moving averages such as the MA-20 at $1.8806, MA-50 at $2.1450, and MA-200 at $2.4641, confirming downward pressure across all major timeframes.
Highlights
- NEAR trades at $1.777 below all major moving averages (MA-20 at $1.8806, MA-50 at $2.1450, MA-200 at $2.4641), confirming sustained downward pressure.
- Technical indicators signal a bearish trend: daily and weekly MACD show sell signals, while RSI D1 at 37.78 and CCI D1 at –102.07 indicate oversold conditions.
- Expected five-day price range is $1.75–$2.15 with less than 20% probability of an increase; declines are more likely unless NEAR breaks above $2.15.
Bearish signals persist as resistance and support define range
The nearest dynamic resistance is marked by the Ichimoku Kijun at $2.1240, which may act as a barrier, while support is likely in the $1.70 – $1.75 zone based on recent price action. Momentum indicators are mixed but lean bearish overall: the MACD on the daily and weekly timeframe signals a sell, while ADX shows weak trend strength. Most oscillators (RSI D1 at 37.78, CCI D1 oversold at –102.07, and bearish BBP at –0.0404) indicate oversold conditions and continued seller dominance, though daily Stoch RSI is not in the extreme. Today’s session saw a gap up from $1.66 to $1.702, with the current price trading near the high of today’s range ($1.691 – $1.796). This reflects high intraday volatility and a firm tone with buyers pushing toward session highs, but underlying momentum remains weak and directionless.
Downside favored as technicals and volatility cap upside potential
Looking ahead, the expected price range for NEAR over the next five days is $1.75 – $2.15, representing a volatility band relative to current levels. The probability of a price increase remains very low (less than 20%), making the likelihood of a decline the more probable scenario given unanimous sell signals across weekly MA-50, MACD-w1, and RSI-w1. The baseline scenario is continued sideways action between $1.75 and $2.15. A breakout above $2.15 may target the $2.20 – $2.30 zone, while a move below $1.75 could open downside toward $1.70 or lower if downward pressure persists.
Previously it was reported that NEAR remains in a bearish structure, trading below its primary moving averages with momentum indicators such as MACD, ADX, and RSI signaling ongoing selling pressure and weakened directional strength. Resistance is defined at the Ichimoku Kijun while support lies just under current levels, as sellers dominate and volatility remains elevated — for further analysis, see bearish structure, trading below its primary averages.


-
 Afghanistan
-
 Albania
-
 Algeria
-
 Angola
-
 Argentina
-
 Armenia
-
 Australia
-
 Austria
-
 Azerbaijan
-
 Bahamas
-
 Bahrain
-
 Bangladesh
-
 Belarus
-
 Belgium
-
 Bolivia
-
 Botswana
-
 Brazil
-
 Brunei
-
 Bulgaria
-
 Cambodia
-
 Cameroon
-
 Canada
-
 Chile
Chile
-
 China
China
-
 Colombia
-
 Congo
Congo
-
 Costa Rica
-
 Cote d'Ivoire
-
 Croatia
-
 Cuba
Cuba
-
 Cyprus
-
 Czechia
-
 DR Congo
-
 Denmark
-
 Dominican Republic
-
 Ecuador
-
 Egypt
Egypt
-
 El Salvador
-
 Estonia
-
 Eswatini
-
 Ethiopia
-
 Finland
-
 France
-
 Georgia
-
 Germany
-
 Ghana
Ghana
-
 Greece
-
 Haiti
Haiti
-
 Hong Kong
-
 Hungary
-
 India
India
-
 Indonesia
-
 Iran, Islamic republic
-
 Iraq
Iraq
-
 Ireland
-
 Israel
-
 Italy
Italy
-
 Jamaica
-
 Japan
Japan
-
 Jordan
-
 Kazakhstan
-
 Kenya
Kenya
-
 Korea
Korea
-
 Kuwait
-
 Kyrgyzstan
-
 Laos
Laos
-
 Latvia
-
 Lebanon
-
 Lesotho
-
 Libya
Libya
-
 Lithuania
-
 Luxembourg
-
 Madagascar
-
 Malaysia
-
 Malta
Malta
-
 Mauritius
-
 Mexico
-
 Moldova
-
 Mongolia
-
 Montenegro
-
 Morocco
-
 Mozambique
-
 Myanmar
-
 Namibia
-
 Nepal
Nepal
-
 Netherlands
-
 New Zealand
-
 Nigeria
-
 North Macedonia
-
 Norway
-
 Oman
Oman
-
 Pakistan
-
 Palestine
-
 Panama
-
 Papua New Guinea
-
 Paraguay
-
 Peru
Peru
-
 Philippines
-
 Poland
-
 Portugal
-
 Puerto Rico
-
 Qatar
Qatar
-
 Reunion
-
 Romania
-
 Rwanda
-
 Saudi Arabia
-
 Serbia
-
 Singapore
-
 Slovakia
-
 Slovenia
-
 Somalia
-
 South Africa
-
 Spain
Spain
-
 Sri Lanka
-
 Sweden
-
 Switzerland
-
 Syria
Syria
-
 Taiwan
-
 Tajikistan
-
 Tanzania
-
 Thailand
-
 Trinidad and Tobago
-
 Tunisia
-
 Turkey
-
 UAE
UAE
-
 Uganda
-
 Ukraine
-
 United Kingdom
-
United States
-
 Uruguay
-
 Uzbekistan
-
 Venezuela
-
 Vietnam
-
 Yemen
Yemen
-
 Zambia
-
 Zimbabwe
- Forex
- Crypto
