
Near latest news: NEAR/USD hovers above $1.85—sideways action likely between $1.74 and $2.23

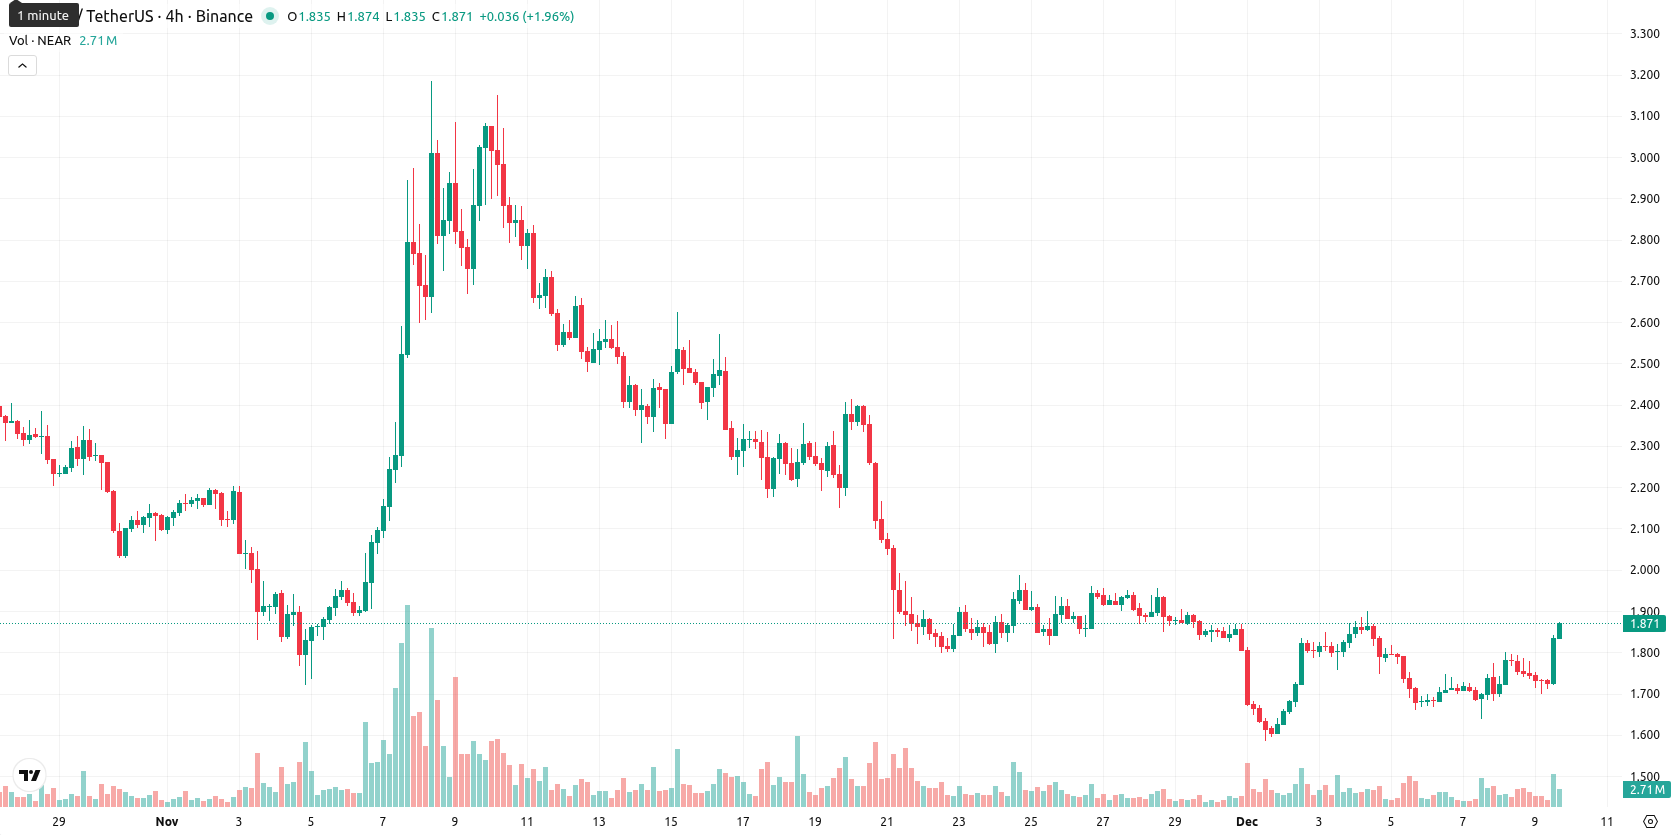
Near (NEAR/USD) is trading at $1.861, just above the MA-20 ($1.8539), after gaining $0.082 or 4.61% on the day. The price remains below both the MA-50 ($2.1347) and MA-200 ($2.4574), indicating short-term buyers are attempting to regain control but medium- and long-term trends are still under bearish pressure.
 1.941
2.1080
1.941
2.1080
Highlights
- NEAR/USD trades at $1.861, up 4.61% today, positioned above MA-20 ($1.8539) but still below MA-50 ($2.1347) and MA-200 ($2.4574).
- Momentum signals remain bearish overall, with MACD showing strong selling, D1 RSI and CCI in sell mode, and Stoch RSI overbought, indicating mixed short-term sentiment.
- NEAR/USD is expected to fluctuate between $1.74 and $2.23 over the next five days, with a less than 20% probability of an upward breakout.
Modest bearish control as mixed momentum weakens trend
Technical readings show NEAR/USD hovering near immediate support at the Ichimoku Kijun ($2.1040), with resistance expected near the MA-50 or $2.10 zone. D1 MACD signals strong selling while ADX suggests weak trend strength, and oscillators are mixed: D1 RSI and CCI are in sell mode but Stoch RSI is deep in overbought territory. The BBP indicator is slightly negative, indicating sellers hold a modest advantage in intraday flows.
Limited breakout potential as volatility constrains upside
Over the next five trading days, NEAR/USD is likely to fluctuate between $1.74 and $2.23, reflecting typical volatility in the current zone. The probability of an upward move is low, below 20%, as key weekly trend indicators show no clear buy signals. The most likely scenario is sideways movement within this band, though a push above $2.10–$2.13 could trigger a bullish breakout, while a decline below $1.74 would reinforce bearish momentum.
Previously it was reported that NEAR was trading below major moving averages with ongoing bearish momentum as technical indicators such as MACD and RSI signaled persistent selling pressure. Resistance was observed near the Ichimoku Kijun while support held in the lower range, as increased volatility and a lack of directional strength continued to cap upside potential — for further context, see cap upside potential — for further context.








-
 Afghanistan
-
 Albania
-
 Algeria
-
 Angola
-
 Argentina
-
 Armenia
-
 Australia
-
 Austria
-
 Azerbaijan
-
 Bahamas
-
 Bahrain
-
 Bangladesh
-
 Belarus
-
 Belgium
-
 Bolivia
-
 Botswana
-
 Brazil
-
 Brunei
-
 Bulgaria
-
 Cambodia
-
 Cameroon
-
 Canada
-
 Chile
Chile
-
 China
China
-
 Colombia
-
 Congo
Congo
-
 Costa Rica
-
 Cote d'Ivoire
-
 Croatia
-
 Cuba
Cuba
-
 Cyprus
-
 Czechia
-
 DR Congo
-
 Denmark
-
 Dominican Republic
-
 Ecuador
-
 Egypt
Egypt
-
 El Salvador
-
 Estonia
-
 Eswatini
-
 Ethiopia
-
 Finland
-
 France
-
 Georgia
-
 Germany
-
 Ghana
Ghana
-
 Greece
-
 Haiti
Haiti
-
 Hong Kong
-
 Hungary
-
 India
India
-
 Indonesia
-
 Iran, Islamic republic
-
 Iraq
Iraq
-
 Ireland
-
 Israel
-
 Italy
Italy
-
 Jamaica
-
 Japan
Japan
-
 Jordan
-
 Kazakhstan
-
 Kenya
Kenya
-
 Korea
Korea
-
 Kuwait
-
 Kyrgyzstan
-
 Laos
Laos
-
 Latvia
-
 Lebanon
-
 Lesotho
-
 Libya
Libya
-
 Lithuania
-
 Luxembourg
-
 Madagascar
-
 Malaysia
-
 Malta
Malta
-
 Mauritius
-
 Mexico
-
 Moldova
-
 Mongolia
-
 Montenegro
-
 Morocco
-
 Mozambique
-
 Myanmar
-
 Namibia
-
 Nepal
Nepal
-
 Netherlands
-
 New Zealand
-
 Nigeria
-
 North Macedonia
-
 Norway
-
 Oman
Oman
-
 Pakistan
-
 Palestine
-
 Panama
-
 Papua New Guinea
-
 Paraguay
-
 Peru
Peru
-
 Philippines
-
 Poland
-
 Portugal
-
 Puerto Rico
-
 Qatar
Qatar
-
 Reunion
-
 Romania
-
 Rwanda
-
 Saudi Arabia
-
 Serbia
-
 Singapore
-
 Slovakia
-
 Slovenia
-
 Somalia
-
 South Africa
-
 Spain
Spain
-
 Sri Lanka
-
 Sweden
-
 Switzerland
-
 Syria
Syria
-
 Taiwan
-
 Tajikistan
-
 Tanzania
-
 Thailand
-
 Trinidad and Tobago
-
 Tunisia
-
 Turkey
-
 UAE
UAE
-
 Uganda
-
 Ukraine
-
 United Kingdom
-
United States
-
 Uruguay
-
 Uzbekistan
-
 Venezuela
-
 Vietnam
-
 Yemen
Yemen
-
 Zambia
-
 Zimbabwe
- Forex
- Crypto











