
Polkadot today news: DOT bearish trend intact, eyes on March 2026 halving and accumulation zone

Polkadot (DOT) remains well below its MA-20 ($2.229), MA-50 ($2.633), and MA-200 ($3.556), reflecting sustained downside pressure across short-, medium-, and long-term trends. The current price is also under the Ichimoku Kijun level ($2.430), with no dynamic resistance ahead until that level and support established near the lower end of today’s range.
DOT price prediction
Current price:
$ 0.803
-0.034
4.06%
Real-time Data
07:18
Daily range
0.802
 0.827
0.827
Weekly range
0.806
0.874
Loading...
Highlights
- Polkadot secured approximately $1.75 million from a $1.25 billion investment fund and remains included in the BITW Crypto Index as of December 2025, signaling persistent institutional interest.
- Polkadot will halve its annual token issuance from 120 million to 55 million DOT on March 14, 2026, reshaping future supply dynamics.
- Some market participants continue to monitor the long-term accumulation zone near $2 for Polkadot, viewing it as a secondary technical focus.
Supply shift anticipated as institutional flows and token issuance halve
Polkadot is currently seeing ongoing institutional attention, as it continues to be included in the BITW Crypto Index and was allocated approximately $1.75 million within a $1.25 billion investment fund as of December 2025. The asset is also set to halve its annual token issuance from 120 million to 55 million DOT on March 14, 2026, which will impact future supply dynamics. The ongoing testing of the long-term accumulation zone near $2 remains a secondary focus for some market participants.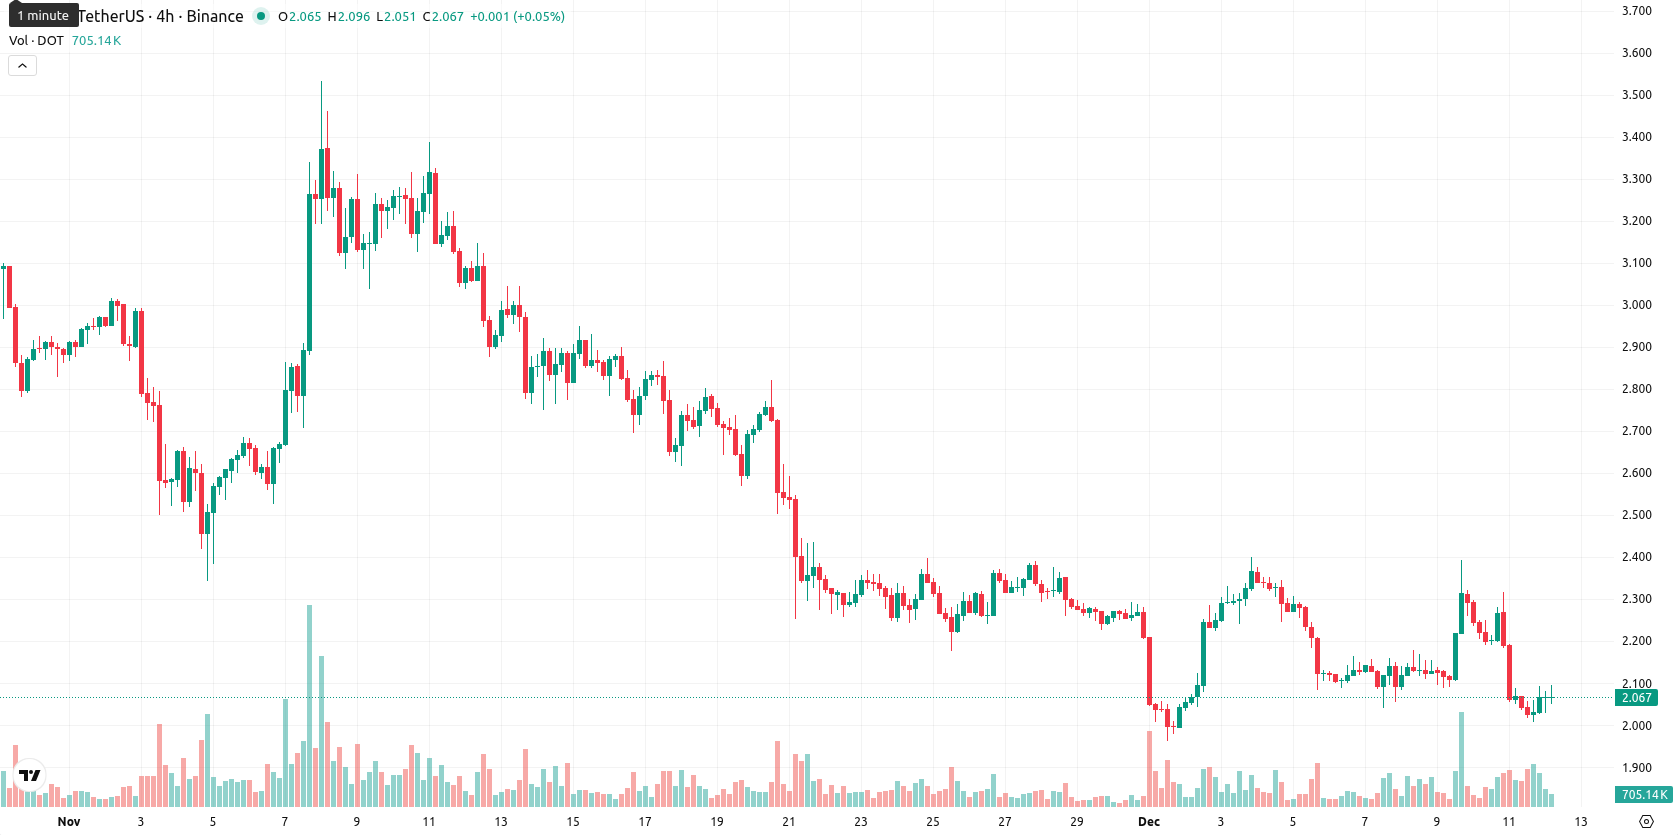
Bearish momentum persists amid oversold oscillators and negative signals
Momentum dynamics remain weak. The D1 MACD and ADX both signal selling pressure, with MACD indicating strong bearish momentum and ADX reflecting a firm negative trend. Oscillators show oversold conditions via the CCI (–128) and RSI (37.6), while Stoch RSI highlights a strong sell signal. BBP is negative (–0.016), signifying sellers hold the advantage intraday. The Awesome Oscillator is neutral and does not reinforce the downtrend. Price action today shows a small opening gap lower, drifting from the previous close at $2.086 to an open at $2.066, and the session sees DOT trading near the mid-range of $2.03–$2.095 on moderate volatility. Downward pressure persists after the open, as downside momentum and declining oscillators broadly align, with no clear signs of reversal.Low rebound odds as consolidation favors further downside risk
Over the next five sessions, DOT is expected to trade within a typical volatility band of $1.96 to $2.20, given the current price and volatility patterns. The probability of a significant price increase remains very low, suggesting further declines are more likely. The baseline scenario anticipates sideways consolidation between $1.96 and $2.20; a move above $2.20 could bring a test of the Ichimoku Kijun level near $2.43, while a drop below $1.96 risks acceleration toward new lows if support fails.
Viktoras Karapetjanc, expert at Traders Union, sees Polkadot’s continued institutional backing and supply reduction plans as key positives. He believes that macro and sentiment dynamics could help counterbalance ongoing technical weakness. The analyst acknowledges short-term bearish signals but views the accumulation zone near $2 as a potential base for longer-term upside. He remains constructive despite downside pressure. "If DOT manages to stabilize and hold above $1.96, I expect growing institutional demand and the future halving to support a more constructive outlook into 2026."
Previously it was reported that Polkadot continued to trade below key moving averages — signaling sustained selling pressure as technical indicators such as MACD and ADX indicated ongoing bearish momentum. While some minor buying attempts were observed intraday, market sentiment stayed negative and the asset remained weak after a sharp daily decline of 10.2% amid heightened volatility.
Source of Data:
DOT Price Analysis by TU
The analysis is based on a proprietary model combining technical, on-chain, and expert data. Not investment advice. See
methodology
The information is based on forecasts and does not constitute investment advice or a guarantee of future results. Market conditions may change. See our Disclaimer and Editorial Integrity for details.
Subscribe to TU news

Did you like the article?


Latest Polkadot News


Weekly Top Bonuses

Top News


Top 5 companies for you

United States
-
 Afghanistan
-
 Albania
-
 Algeria
-
 Angola
-
 Argentina
-
 Armenia
-
 Australia
-
 Austria
-
 Azerbaijan
-
 Bahamas
-
 Bahrain
-
 Bangladesh
-
 Belarus
-
 Belgium
-
 Bolivia
-
 Botswana
-
 Brazil
-
 Brunei
-
 Bulgaria
-
 Cambodia
-
 Cameroon
-
 Canada
-
 Chile
Chile
-
 China
China
-
 Colombia
-
 Congo
Congo
-
 Costa Rica
-
 Cote d'Ivoire
-
 Croatia
-
 Cuba
Cuba
-
 Cyprus
-
 Czechia
-
 DR Congo
-
 Denmark
-
 Dominican Republic
-
 Ecuador
-
 Egypt
Egypt
-
 El Salvador
-
 Estonia
-
 Eswatini
-
 Ethiopia
-
 Finland
-
 France
-
 Georgia
-
 Germany
-
 Ghana
Ghana
-
 Greece
-
 Haiti
Haiti
-
 Hong Kong
-
 Hungary
-
 India
India
-
 Indonesia
-
 Iran, Islamic republic
-
 Iraq
Iraq
-
 Ireland
-
 Israel
-
 Italy
Italy
-
 Jamaica
-
 Japan
Japan
-
 Jordan
-
 Kazakhstan
-
 Kenya
Kenya
-
 Korea
Korea
-
 Kuwait
-
 Kyrgyzstan
-
 Laos
Laos
-
 Latvia
-
 Lebanon
-
 Lesotho
-
 Libya
Libya
-
 Lithuania
-
 Luxembourg
-
 Madagascar
-
 Malaysia
-
 Malta
Malta
-
 Mauritius
-
 Mexico
-
 Moldova
-
 Mongolia
-
 Montenegro
-
 Morocco
-
 Mozambique
-
 Myanmar
-
 Namibia
-
 Nepal
Nepal
-
 Netherlands
-
 New Zealand
-
 Nigeria
-
 North Macedonia
-
 Norway
-
 Oman
Oman
-
 Pakistan
-
 Palestine
-
 Panama
-
 Papua New Guinea
-
 Paraguay
-
 Peru
Peru
-
 Philippines
-
 Poland
-
 Portugal
-
 Puerto Rico
-
 Qatar
Qatar
-
 Reunion
-
 Romania
-
 Rwanda
-
 Saudi Arabia
-
 Serbia
-
 Singapore
-
 Slovakia
-
 Slovenia
-
 Somalia
-
 South Africa
-
 Spain
Spain
-
 Sri Lanka
-
 Sweden
-
 Switzerland
-
 Syria
Syria
-
 Taiwan
-
 Tajikistan
-
 Tanzania
-
 Thailand
-
 Trinidad and Tobago
-
 Tunisia
-
 Turkey
-
 UAE
UAE
-
 Uganda
-
 Ukraine
-
 United Kingdom
-
United States
-
 Uruguay
-
 Uzbekistan
-
 Venezuela
-
 Vietnam
-
 Yemen
Yemen
-
 Zambia
-
 Zimbabwe
- Forex
- Crypto
Live News
