
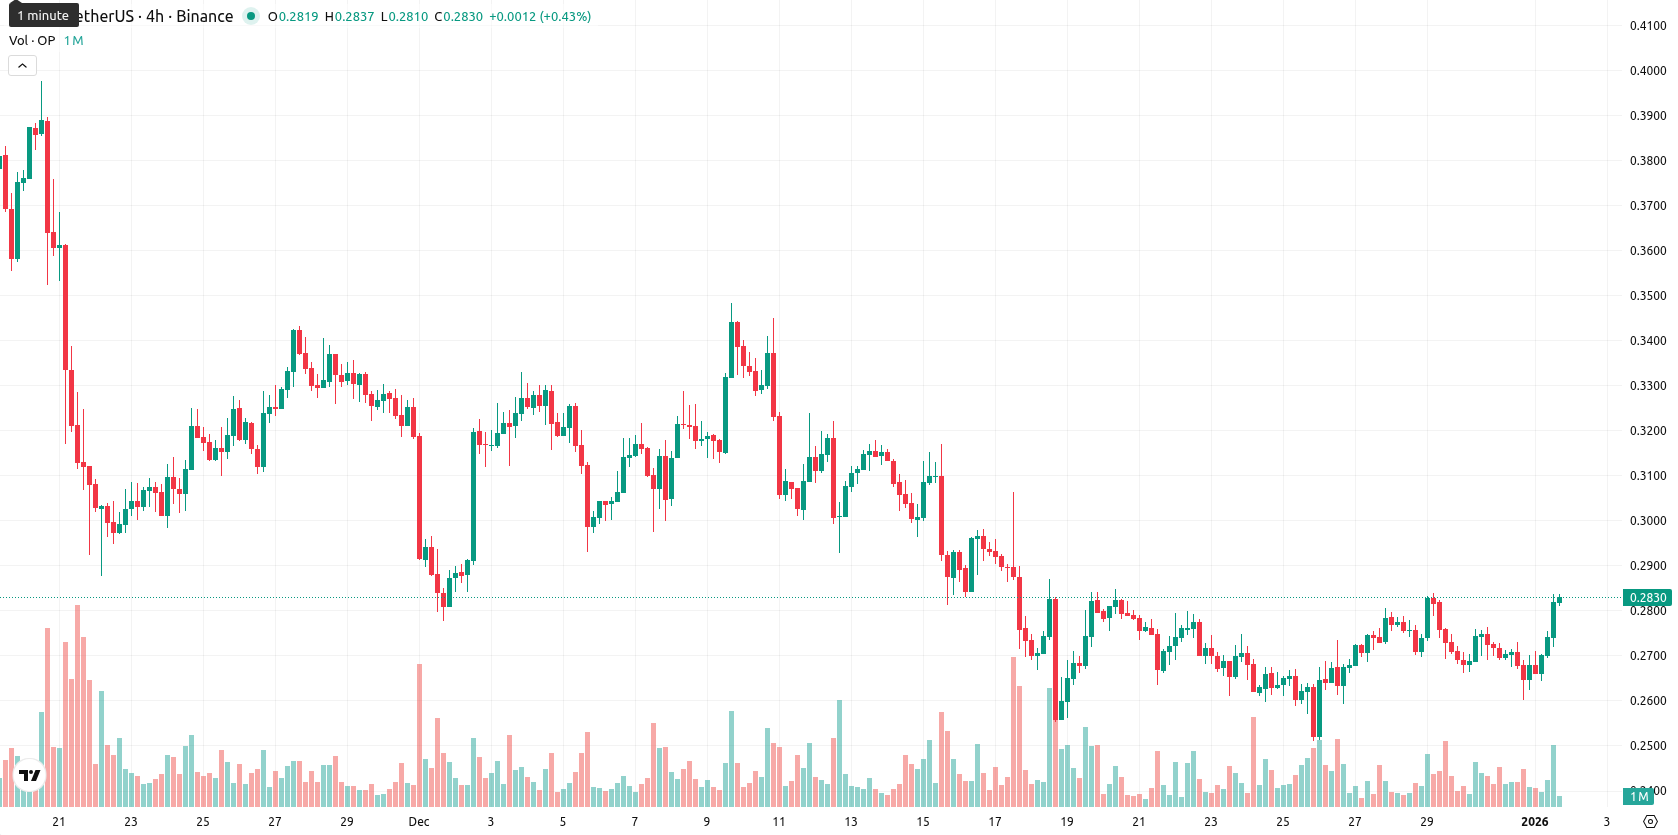
Optimism price prediction: Can momentum shift? OP rises 7.90% after intraday volatility

Optimism (OP) is trading at $0.2828 after a daily increase of 7.90%. The asset remains above the MA-20 ($0.2780) but stays below both MA-50 ($0.3128) and MA-200 ($0.5528), signaling short-term strength while facing medium- and long-term bearish pressure.
Highlights
- OP rose 7.90% to $0.2828, trading above MA-20 ($0.2780) but below MA-50 ($0.3128) and MA-200 ($0.5528), showing short-term strength within a bearish trend.
- Strong downside momentum persists, as D1 MACD signals 'Strong Sell,' ADX confirms a bearish trend, and sellers dominate Bull/Bear Power despite intraday buying pressure.
- OP is expected to move sideways between $0.258 and $0.298 over the next five days, with a less than 20% probability of breaking higher and risk skewed to further declines.
Bearish momentum and volatile swings as technical boundaries converge
Currently, OP's price structure shows the MA-20 serving as immediate support, with the Ichimoku Kijun level at $0.2996 as the nearest resistance; the Kijun and MA-20 levels define key directional zones. Momentum remains decisively bearish: the D1 MACD signals 'Strong Sell', the ADX points to a strong downside trend, and both RSI and CCI indicate weak, slightly oversold conditions. Bull/Bear Power underscores seller dominance on the daily chart, while an intraday surge and trading near session highs reflect ongoing volatility and persistent buying after the open. Several oscillators are already overbought on shorter timeframes, and the Awesome Oscillator reads as neutral, suggesting a short-term divergence between robust price action and flagging momentum.
Sideways bias as limited breakout odds constrain near-term direction
OP is expected to trade within a $0.258 to $0.298 volatility band relative to current levels over the next five trading days. The chance of a sustained price rally above resistance is below 20%, with sideways action favored between $0.258 and $0.298. Downward momentum could bring the price below $0.264, targeting the $0.258 support, while a confirmed move above $0.2996 would be needed for a bullish breakout.
Previously it was reported that Optimism (OP) remains under pressure, trading below all key moving averages with persistent bearish momentum as confirmed by negative MACD, strong ADX, and deeply oversold oscillator readings. While a minor rally has prompted short-term divergence, the asset faces strong resistance near $0.3018 and is likely to stay rangebound between $0.260 and $0.300 absent a decisive shift in trend.


-
 Afghanistan
-
 Albania
-
 Algeria
-
 Angola
-
 Argentina
-
 Armenia
-
 Australia
-
 Austria
-
 Azerbaijan
-
 Bahamas
-
 Bahrain
-
 Bangladesh
-
 Belarus
-
 Belgium
-
 Bolivia
-
 Botswana
-
 Brazil
-
 Brunei
-
 Bulgaria
-
 Cambodia
-
 Cameroon
-
 Canada
-
 Chile
Chile
-
 China
China
-
 Colombia
-
 Congo
Congo
-
 Costa Rica
-
 Cote d'Ivoire
-
 Croatia
-
 Cuba
Cuba
-
 Cyprus
-
 Czechia
-
 DR Congo
-
 Denmark
-
 Dominican Republic
-
 Ecuador
-
 Egypt
Egypt
-
 El Salvador
-
 Estonia
-
 Eswatini
-
 Ethiopia
-
 Finland
-
 France
-
 Georgia
-
 Germany
-
 Ghana
Ghana
-
 Greece
-
 Haiti
Haiti
-
 Hong Kong
-
 Hungary
-
 India
India
-
 Indonesia
-
 Iran, Islamic republic
-
 Iraq
Iraq
-
 Ireland
-
 Israel
-
 Italy
Italy
-
 Jamaica
-
 Japan
Japan
-
 Jordan
-
 Kazakhstan
-
 Kenya
Kenya
-
 Korea
Korea
-
 Kuwait
-
 Kyrgyzstan
-
 Laos
Laos
-
 Latvia
-
 Lebanon
-
 Lesotho
-
 Libya
Libya
-
 Lithuania
-
 Luxembourg
-
 Madagascar
-
 Malaysia
-
 Malta
Malta
-
 Mauritius
-
 Mexico
-
 Moldova
-
 Mongolia
-
 Montenegro
-
 Morocco
-
 Mozambique
-
 Myanmar
-
 Namibia
-
 Nepal
Nepal
-
 Netherlands
-
 New Zealand
-
 Nigeria
-
 North Macedonia
-
 Norway
-
 Oman
Oman
-
 Pakistan
-
 Palestine
-
 Panama
-
 Papua New Guinea
-
 Paraguay
-
 Peru
Peru
-
 Philippines
-
 Poland
-
 Portugal
-
 Puerto Rico
-
 Qatar
Qatar
-
 Reunion
-
 Romania
-
 Rwanda
-
 Saudi Arabia
-
 Serbia
-
 Singapore
-
 Slovakia
-
 Slovenia
-
 Somalia
-
 South Africa
-
 Spain
Spain
-
 Sri Lanka
-
 Sweden
-
 Switzerland
-
 Syria
Syria
-
 Taiwan
-
 Tajikistan
-
 Tanzania
-
 Thailand
-
 Trinidad and Tobago
-
 Tunisia
-
 Turkey
-
 UAE
UAE
-
 Uganda
-
 Ukraine
-
 United Kingdom
-
United States
-
 Uruguay
-
 Uzbekistan
-
 Venezuela
-
 Vietnam
-
 Yemen
Yemen
-
 Zambia
-
 Zimbabwe
- Forex
- Crypto
