
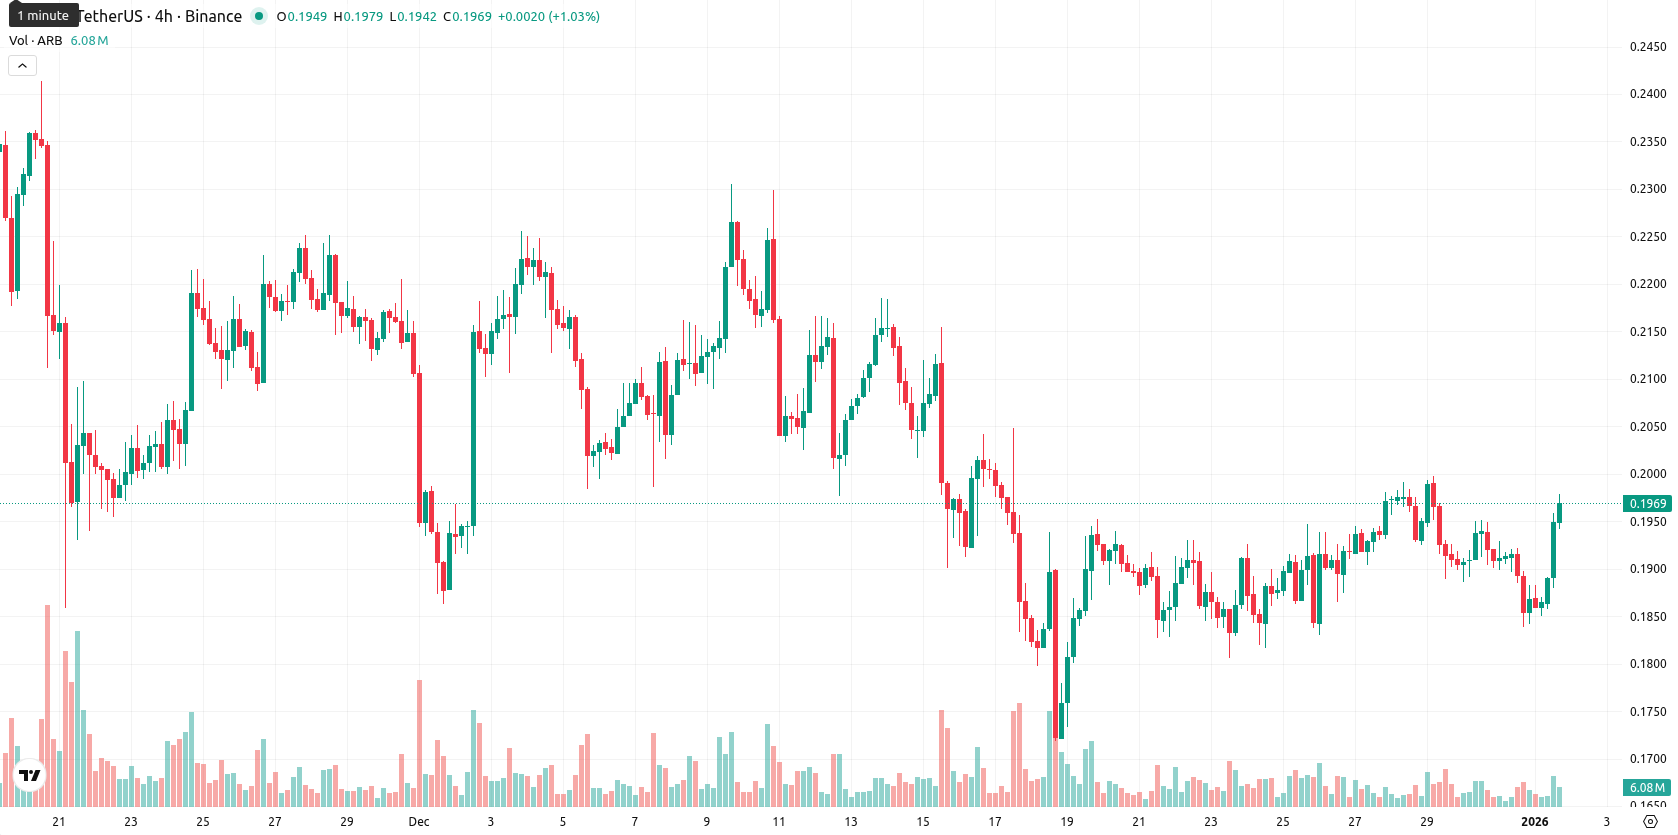
+7.12% for Arbitrum — price challenges resistance despite ongoing downside momentum

Arbitrum (ARB) is currently trading at $0.1971, positioned slightly above the MA-20 at $0.1928 but still below both the MA-50 ($0.2085) and MA-200 ($0.3572), suggesting mild short-term strength amid persistent medium- and long-term downward pressure.
Highlights
- Arbitrum maintains a market capitalization near $1.07 billion, solidifying its status as a mid-cap Layer-2 solution in the Ethereum ecosystem.
- Growth drivers for Arbitrum are linked to total value locked, transaction throughput, and increased adoption by decentralized applications.
- Sustained trader and investor attention underscores Arbitrum’s current relevance within the broader crypto infrastructure landscape.
Sustained adoption momentum as Layer-2 utility draws investor focus
Recent developments highlight Arbitrum's role as a leading Layer-2 infrastructure focused on Ethereum scalability and transaction fee optimization. The asset is reported to maintain its mid-cap Layer-2 status with a market capitalization near $1.07 billion, with growth tied to total value locked, transaction throughput, and adoption by decentralized applications. Ongoing attention by traders and investors reflects its position in the broader crypto infrastructure landscape.
Bearish momentum prevails amid diverging intraday strength and resistance
The nearest dynamic support lies at the Ichimoku Kijun at $0.2012, which also acts as immediate resistance, reflecting sellers’ dominance on higher timeframes. Momentum indicators remain generally bearish on the daily timeframe, with MACD signaling a strong sell and ADX posting a high value, confirming active downside pressure. RSI at 42.1, Stoch RSI indicating neutrality near higher levels, and CCI at -55 all reflect the absence of oversold signals but continued weak bias. Bull/Bear Power on D1 shows slight buyer pressure, but the overall day’s move—a 7.12% rise to $0.1971 without a significant gap—puts the price near the daily high of $0.1977, suggesting high volatility and persistent strength toward session highs. However, with oscillators and momentum indicators offering conflicting signals, there is a divergence between strong intraday recovery and the ongoing medium-term bearish structure.
Downside risk dominates as breakout above key levels remains unlikely
For the next five trading days, the expected price range is $0.1850 to $0.2150, reflecting typical volatility band relative to current levels. The probability of an upward move is very low (less than 20%), making a downside scenario more likely. In the baseline scenario, ARB consolidates sideways within a narrow corridor. A bullish case would require a decisive break above both $0.2012 and the MA-50 at $0.2085, while a bearish development could see the price slipping back below $0.1928 and challenging the $0.1850 area if buyer strength fades and bearish momentum persists.
Previously it was reported that Arbitrum (ARB) remains in a sustained downtrend, trading below all major moving averages with persistent bearish momentum confirmed by MACD and ADX, while momentum indicators such as RSI and Stochastic RSI highlight oversold conditions that may limit further immediate downside. The asset faces dynamic resistance at the Ichimoku Kijun level near $0.2012, with consolidation expected within a volatile $0.175–$0.210 range and low probability of a significant near-term rebound.


Latest Arbitrum News


-
 Afghanistan
-
 Albania
-
 Algeria
-
 Angola
-
 Argentina
-
 Armenia
-
 Australia
-
 Austria
-
 Azerbaijan
-
 Bahamas
-
 Bahrain
-
 Bangladesh
-
 Belarus
-
 Belgium
-
 Bolivia
-
 Botswana
-
 Brazil
-
 Brunei
-
 Bulgaria
-
 Cambodia
-
 Cameroon
-
 Canada
-
 Chile
Chile
-
 China
China
-
 Colombia
-
 Congo
Congo
-
 Costa Rica
-
 Cote d'Ivoire
-
 Croatia
-
 Cuba
Cuba
-
 Cyprus
-
 Czechia
-
 DR Congo
-
 Denmark
-
 Dominican Republic
-
 Ecuador
-
 Egypt
Egypt
-
 El Salvador
-
 Estonia
-
 Eswatini
-
 Ethiopia
-
 Finland
-
 France
-
 Georgia
-
 Germany
-
 Ghana
Ghana
-
 Greece
-
 Haiti
Haiti
-
 Hong Kong
-
 Hungary
-
 India
India
-
 Indonesia
-
 Iran, Islamic republic
-
 Iraq
Iraq
-
 Ireland
-
 Israel
-
 Italy
Italy
-
 Jamaica
-
 Japan
Japan
-
 Jordan
-
 Kazakhstan
-
 Kenya
Kenya
-
 Korea
Korea
-
 Kuwait
-
 Kyrgyzstan
-
 Laos
Laos
-
 Latvia
-
 Lebanon
-
 Lesotho
-
 Libya
Libya
-
 Lithuania
-
 Luxembourg
-
 Madagascar
-
 Malaysia
-
 Malta
Malta
-
 Mauritius
-
 Mexico
-
 Moldova
-
 Mongolia
-
 Montenegro
-
 Morocco
-
 Mozambique
-
 Myanmar
-
 Namibia
-
 Nepal
Nepal
-
 Netherlands
-
 New Zealand
-
 Nigeria
-
 North Macedonia
-
 Norway
-
 Oman
Oman
-
 Pakistan
-
 Palestine
-
 Panama
-
 Papua New Guinea
-
 Paraguay
-
 Peru
Peru
-
 Philippines
-
 Poland
-
 Portugal
-
 Puerto Rico
-
 Qatar
Qatar
-
 Reunion
-
 Romania
-
 Rwanda
-
 Saudi Arabia
-
 Serbia
-
 Singapore
-
 Slovakia
-
 Slovenia
-
 Somalia
-
 South Africa
-
 Spain
Spain
-
 Sri Lanka
-
 Sweden
-
 Switzerland
-
 Syria
Syria
-
 Taiwan
-
 Tajikistan
-
 Tanzania
-
 Thailand
-
 Trinidad and Tobago
-
 Tunisia
-
 Turkey
-
 UAE
UAE
-
 Uganda
-
 Ukraine
-
 United Kingdom
-
United States
-
 Uruguay
-
 Uzbekistan
-
 Venezuela
-
 Vietnam
-
 Yemen
Yemen
-
 Zambia
-
 Zimbabwe
- Forex
- Crypto
