
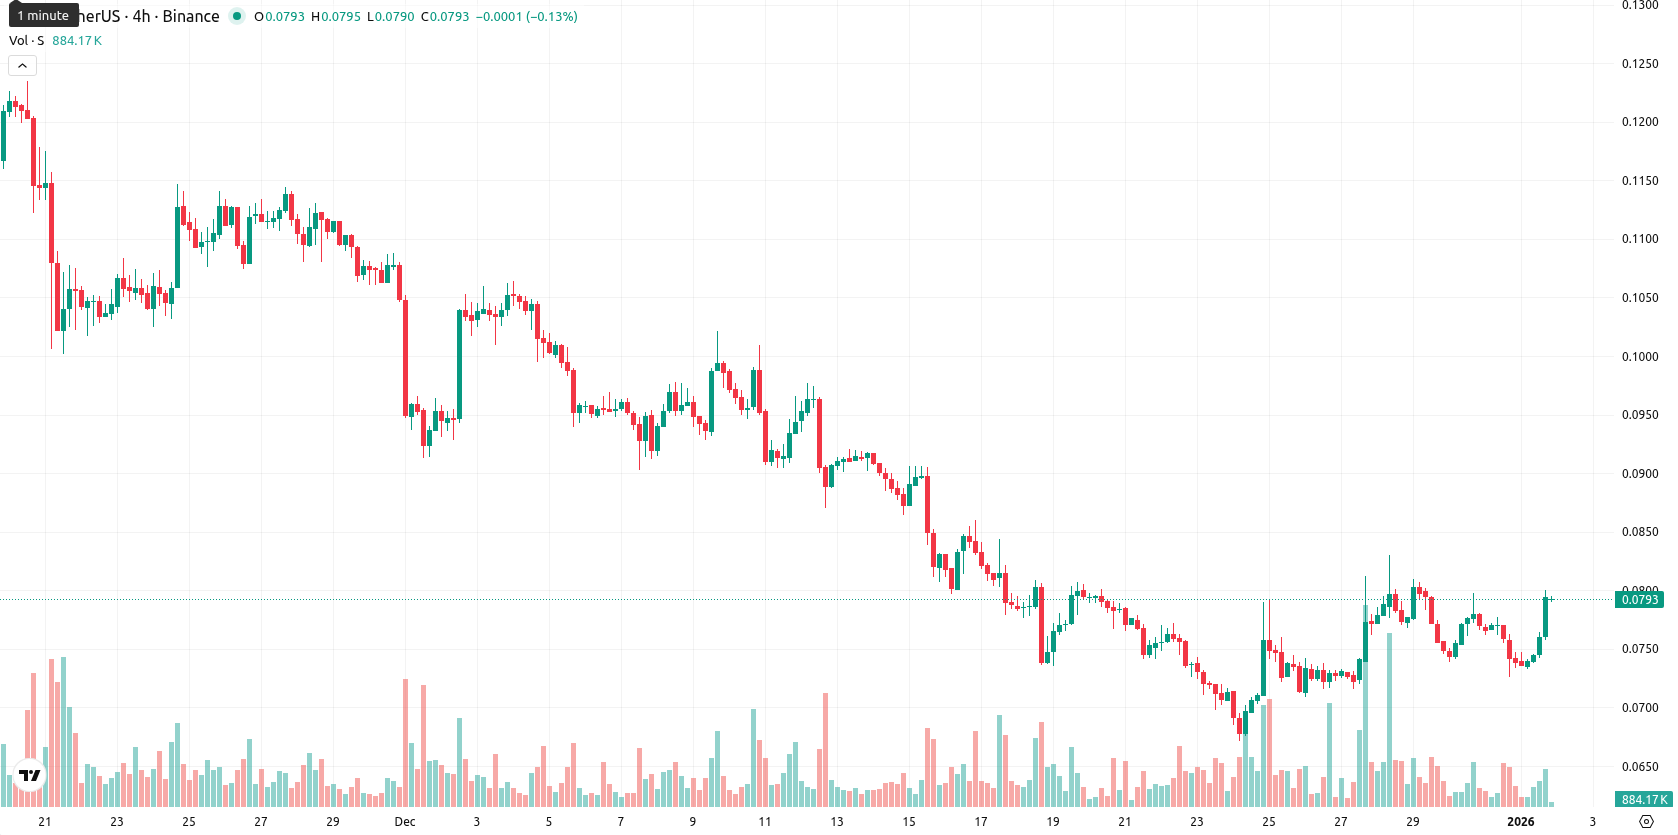
+7.02% for Sonic — buyers spark rally near key resistance despite mixed signals

Sonic (S, formerly Fantom) is currently trading at $0.0793, which is above the MA-20 ($0.0784) but remains well below the MA-50 ($0.0975) and MA-200 ($0.2330). This positioning signals some short-term buying interest but confirms ongoing medium- and long-term bearish pressure, with the nearest dynamic resistance at the Ichimoku Kijun level of $0.0846 and no immediate support from moving averages below the current price.
Highlights
- Sonic Labs extended its convertible bond deal with SonicStrategy by three years, supporting strategic options such as a future Nasdaq listing.
- SonicStrategy’s treasury holds approximately 126 million S tokens valued at around $40 million at issuance under the revised agreement.
- The company continues to lock S tokens, emphasizing long-term security and growth in its digital asset treasury strategy.
Convertible bond extension as Sonic Labs targets long-term security and Nasdaq ambitions
Sonic Labs has announced the extension of its convertible bond arrangement with SonicStrategy, providing an additional three years for potential strategic plans, including a future Nasdaq listing. Approximately 126 million S tokens, valued at around $40 million at issuance, remain in SonicStrategy’s treasury under the extended agreement. The company also emphasized a continued focus on locking its tokens to prioritize long-term security and growth within its digital asset treasury strategy.
Mixed momentum signals as intraday buyers clash with broader bearish trend
Momentum signals are mixed: the ADX on D1 is strong but bearish, while MACD also points to strong downside momentum. Oscillators show divergence — RSI and CCI are in the sell zone, but Stochastic RSI indicates overbought conditions, reflecting a recent surge that could be fading. Bull/Bear Power (BBP) suggests intraday buyers are trying to gain control, supported by a 7.02% daily gain from a near-flat open (no gap), with the current price trading near today's high and volatility moderate to high, signaling strength toward the session highs but apparent tension between short-term buyers and persistent longer-term sellers.
Consolidation outlook amid low upside risk and key resistance level
For the next 5 trading days, the expected price range is adjusted to $0.0730 – $0.0870, consistent with typical volatility. There is a very low probability (less than 20%) of a significant price increase; a further decline is more likely going by the prevailing signals. Baseline scenario: S moves sideways within this band as consolidation persists. Bullish scenario: a breakout above $0.0846 (Kijun resistance) could open the way to test the $0.09 level, while a drop below $0.0730 would increase the risk of a move toward the $0.07 area.
Previously it was reported that Sonic (S) is trading under pressure below its key moving averages, with bearish signals from both momentum and trend indicators such as MACD ADX and RSI reinforcing a strong downtrend. The asset is expected to consolidate within a defined volatility range, with limited rebound potential unless resistance at $0.0846 is overcome, while a break below $0.0670 could accelerate further declines.


-
 Afghanistan
-
 Albania
-
 Algeria
-
 Angola
-
 Argentina
-
 Armenia
-
 Australia
-
 Austria
-
 Azerbaijan
-
 Bahamas
-
 Bahrain
-
 Bangladesh
-
 Belarus
-
 Belgium
-
 Bolivia
-
 Botswana
-
 Brazil
-
 Brunei
-
 Bulgaria
-
 Cambodia
-
 Cameroon
-
 Canada
-
 Chile
Chile
-
 China
China
-
 Colombia
-
 Congo
Congo
-
 Costa Rica
-
 Cote d'Ivoire
-
 Croatia
-
 Cuba
Cuba
-
 Cyprus
-
 Czechia
-
 DR Congo
-
 Denmark
-
 Dominican Republic
-
 Ecuador
-
 Egypt
Egypt
-
 El Salvador
-
 Estonia
-
 Eswatini
-
 Ethiopia
-
 Finland
-
 France
-
 Georgia
-
 Germany
-
 Ghana
Ghana
-
 Greece
-
 Haiti
Haiti
-
 Hong Kong
-
 Hungary
-
 India
India
-
 Indonesia
-
 Iran, Islamic republic
-
 Iraq
Iraq
-
 Ireland
-
 Israel
-
 Italy
Italy
-
 Jamaica
-
 Japan
Japan
-
 Jordan
-
 Kazakhstan
-
 Kenya
Kenya
-
 Korea
Korea
-
 Kuwait
-
 Kyrgyzstan
-
 Laos
Laos
-
 Latvia
-
 Lebanon
-
 Lesotho
-
 Libya
Libya
-
 Lithuania
-
 Luxembourg
-
 Madagascar
-
 Malaysia
-
 Malta
Malta
-
 Mauritius
-
 Mexico
-
 Moldova
-
 Mongolia
-
 Montenegro
-
 Morocco
-
 Mozambique
-
 Myanmar
-
 Namibia
-
 Nepal
Nepal
-
 Netherlands
-
 New Zealand
-
 Nigeria
-
 North Macedonia
-
 Norway
-
 Oman
Oman
-
 Pakistan
-
 Palestine
-
 Panama
-
 Papua New Guinea
-
 Paraguay
-
 Peru
Peru
-
 Philippines
-
 Poland
-
 Portugal
-
 Puerto Rico
-
 Qatar
Qatar
-
 Reunion
-
 Romania
-
 Rwanda
-
 Saudi Arabia
-
 Serbia
-
 Singapore
-
 Slovakia
-
 Slovenia
-
 Somalia
-
 South Africa
-
 Spain
Spain
-
 Sri Lanka
-
 Sweden
-
 Switzerland
-
 Syria
Syria
-
 Taiwan
-
 Tajikistan
-
 Tanzania
-
 Thailand
-
 Trinidad and Tobago
-
 Tunisia
-
 Turkey
-
 UAE
UAE
-
 Uganda
-
 Ukraine
-
 United Kingdom
-
United States
-
 Uruguay
-
 Uzbekistan
-
 Venezuela
-
 Vietnam
-
 Yemen
Yemen
-
 Zambia
-
 Zimbabwe
- Forex
- Crypto
