
Floki: bullish sentiment and aggressive branding fuel sharp price gain

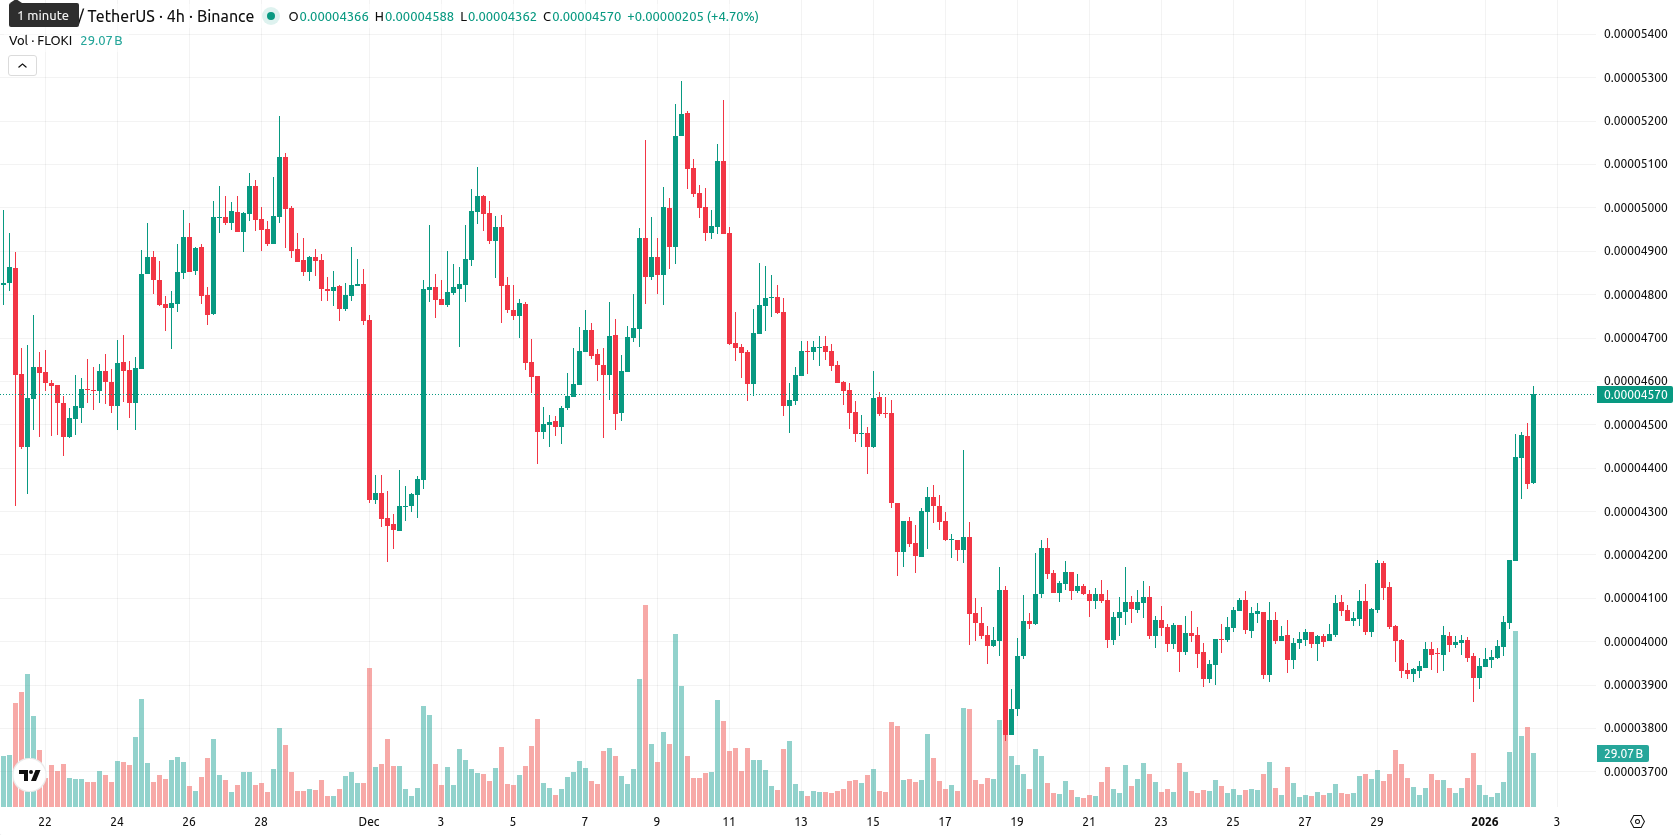
Floki (FLOKI) is currently trading at $0.0000448, positioned above the MA-20 ($0.00004117) but below the MA-50 ($0.00004592) and well beneath the MA-200 ($0.00007996). This configuration indicates short-term bullish momentum, medium-term resistance, and ongoing long-term bearish pressure, with the Ichimoku Kijun at $0.00004531 acting as the next significant dynamic resistance.
Highlights
- Floki's aggressive global branding initiatives and strong community engagement have notably increased its visibility within the crypto sector.
- The project is differentiating itself from typical meme coins by focusing on consistent, branding-led growth to reach a broader audience.
- Sustained community-driven narratives are maintaining high participation and activity levels throughout the Floki ecosystem.
Community-driven branding fuels strong engagement and sector visibility
Recent developments around Floki highlight its reputation for aggressive global branding initiatives and strong community engagement, which have significantly raised its profile within the crypto sector. The project's emphasis on expanding its audience beyond typical meme coin circles has distinguished it through consistent, branding-led growth. Ongoing community-driven narratives continue to sustain high levels of participation within the Floki ecosystem.
Mixed momentum signals as volatility and buying pressure converge
Momentum indicators offer a mixed technical picture: the daily MACD signals a strong sell, but the elevated ADX points to pronounced yet conflicting market forces. While both the RSI (52.6 D1) and CCI suggest a mild bullish trend, the Stoch RSI sits at an overbought 100, signaling possible exhaustion on the recent rally, and the BBP issues a strong buy, indicating buyers currently dominate. The session opened with a gap up, and prices are trading near the day's upper range ($0.0000433–$0.0000450), reflecting high volatility and strength toward session highs. However, conflicting signals from oscillators and momentum tools raise the likelihood that the intraday rally may stall or require consolidation soon.
Bearish weekly indicators constrain upside as sideways range expected
For the upcoming week, the expected price range falls within $0.0000413–$0.0000455, matching typical volatility relative to current levels. The odds of a further price increase are low (less than 20%), as weekly timeframes remain bearish with RSI, MACD, and the MA-50 favoring continued downside. Baseline scenario projects sideways trading within this corridor as buyers and sellers contend for direction. Further upside would require a decisive move above $0.0000453 targeting MA-50, while a break below $0.0000413 could trigger more significant declines toward recent weekly lows.
Previously it was reported that Floki Inu (FLOKI) is trading above its 20-day moving average but remains below the 50- and 200-day averages, indicating a short-term rebound within a broader bearish trend. Technical indicators present mixed momentum as oversold signals (RSI, Stoch RSI, CCI) contrast with continued bearish readings on MACD and ADX, with near-term resistance clustered around the MA-50 and Ichimoku kijun and support marked below at $0.00003978.


Latest Floki News


-
 Afghanistan
-
 Albania
-
 Algeria
-
 Angola
-
 Argentina
-
 Armenia
-
 Australia
-
 Austria
-
 Azerbaijan
-
 Bahamas
-
 Bahrain
-
 Bangladesh
-
 Belarus
-
 Belgium
-
 Bolivia
-
 Botswana
-
 Brazil
-
 Brunei
-
 Bulgaria
-
 Cambodia
-
 Cameroon
-
 Canada
-
 Chile
Chile
-
 China
China
-
 Colombia
-
 Congo
Congo
-
 Costa Rica
-
 Cote d'Ivoire
-
 Croatia
-
 Cuba
Cuba
-
 Cyprus
-
 Czechia
-
 DR Congo
-
 Denmark
-
 Dominican Republic
-
 Ecuador
-
 Egypt
Egypt
-
 El Salvador
-
 Estonia
-
 Eswatini
-
 Ethiopia
-
 Finland
-
 France
-
 Georgia
-
 Germany
-
 Ghana
Ghana
-
 Greece
-
 Haiti
Haiti
-
 Hong Kong
-
 Hungary
-
 India
India
-
 Indonesia
-
 Iran, Islamic republic
-
 Iraq
Iraq
-
 Ireland
-
 Israel
-
 Italy
Italy
-
 Jamaica
-
 Japan
Japan
-
 Jordan
-
 Kazakhstan
-
 Kenya
Kenya
-
 Korea
Korea
-
 Kuwait
-
 Kyrgyzstan
-
 Laos
Laos
-
 Latvia
-
 Lebanon
-
 Lesotho
-
 Libya
Libya
-
 Lithuania
-
 Luxembourg
-
 Madagascar
-
 Malaysia
-
 Malta
Malta
-
 Mauritius
-
 Mexico
-
 Moldova
-
 Mongolia
-
 Montenegro
-
 Morocco
-
 Mozambique
-
 Myanmar
-
 Namibia
-
 Nepal
Nepal
-
 Netherlands
-
 New Zealand
-
 Nigeria
-
 North Macedonia
-
 Norway
-
 Oman
Oman
-
 Pakistan
-
 Palestine
-
 Panama
-
 Papua New Guinea
-
 Paraguay
-
 Peru
Peru
-
 Philippines
-
 Poland
-
 Portugal
-
 Puerto Rico
-
 Qatar
Qatar
-
 Reunion
-
 Romania
-
 Rwanda
-
 Saudi Arabia
-
 Serbia
-
 Singapore
-
 Slovakia
-
 Slovenia
-
 Somalia
-
 South Africa
-
 Spain
Spain
-
 Sri Lanka
-
 Sweden
-
 Switzerland
-
 Syria
Syria
-
 Taiwan
-
 Tajikistan
-
 Tanzania
-
 Thailand
-
 Trinidad and Tobago
-
 Tunisia
-
 Turkey
-
 UAE
UAE
-
 Uganda
-
 Ukraine
-
 United Kingdom
-
United States
-
 Uruguay
-
 Uzbekistan
-
 Venezuela
-
 Vietnam
-
 Yemen
Yemen
-
 Zambia
-
 Zimbabwe
- Forex
- Crypto
