
+2.56% for Shiba Inu — profit shifts and buyer caution amid resistance cap gains

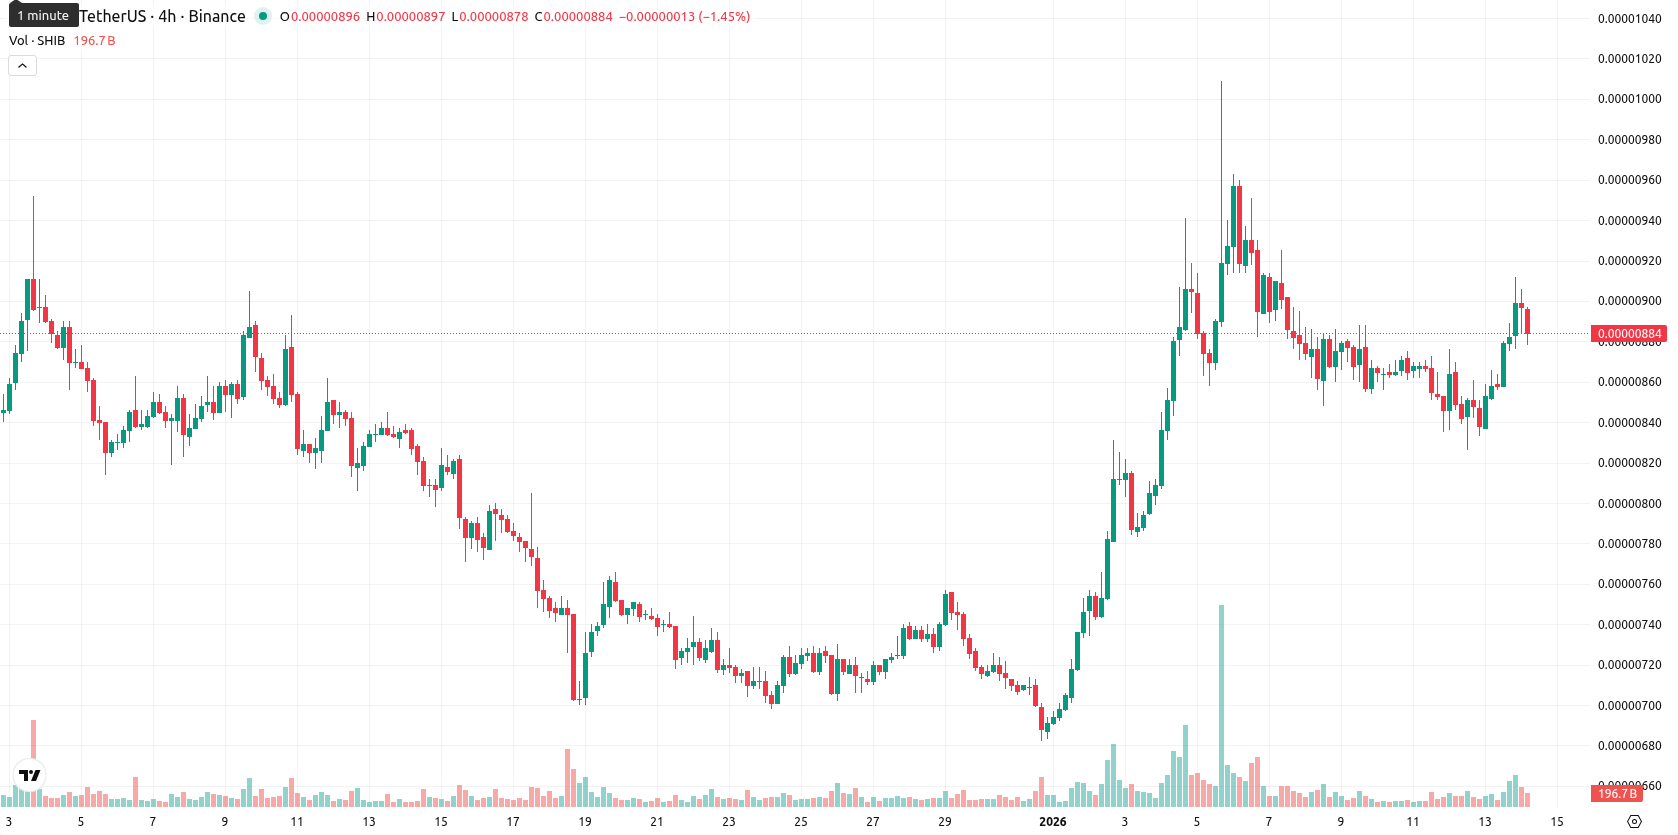
Shiba Inu (SHIB) is trading at $0.0000088, up modestly on the day. The price sits above its MA-20 ($0.00000809) and MA-50 ($0.00000811), while staying notably below the long-term MA-200 ($0.00001090), highlighting prevailing short-term and medium-term bullishness with significant longer-term resistance overhead.
Highlights
- Shiba Inu experienced a sharp 62% weekly drop in the amount of tokens held in profit, signaling rapidly declining holder profitability.
- SHIB recorded a substantial 1,153% surge in net spot inflows, with $144,380 flowing in versus $108,020 out, temporarily supporting a post-decline rebound.
- Increased token movement onto exchanges for SHIB points to rising selling pressure, reflecting potential short-term bearish sentiment among holders.
Holder profitability drops as exchange inflows increase selling risk
Recent on-chain data for Shiba Inu highlights a sharp 62% weekly drop in the amount of tokens held in profit, signaling rapid changes in profitability among holders. Additionally, SHIB saw a substantial 1,153% surge in net spot inflows—$144,380 flowed in versus $108,020 out—briefly supporting a rebound after recent declines. Increased movement of tokens onto exchanges indicates rising selling pressure.
Bullish momentum holds above support despite capped advance
Technical momentum stays positive for SHIB on the daily chart, with both MACD and ADX at 'Buy' and the RSI at 61.8, supporting a bullish bias, though the price remains capped below the MA-200. The current price action finds dynamic support near the Ichimoku Kijun at $0.00000849, with resistance levels at the MA-50 and the round $0.0000090 mark. Stochastic RSI is elevated at 78.4 but does not yet show overbought conditions, CCI remains constructive, and Bull/Bear Power reflects sustained buying. The Awesome Oscillator is neutral, and modest intraday volatility hints at some buyer caution after the session’s open.
Sideways trading likely as downside risk outweighs upside
For the upcoming five sessions, SHIB is likely to remain confined within a volatility band of $0.00000790 – $0.00000910, with sideways action as the base scenario. Most indicators suggest the chance of further upside is low (below 20%), while the risk of a downside move is relatively higher given the longer-term bearish signals. A bullish breakout above $0.00000910 could see a swift move toward higher resistance, but a dip under $0.00000790 may prompt additional selling. Consolidation between the mentioned levels is the most probable course given mixed momentum and resistance overhead.
Last time, analysts noted that Shiba Inu was trading above its short- and medium-term moving averages with bullish momentum indicators such as a positive MACD crossover and strong ADX reading, while resistance remained just above current levels and the price stayed well below the long-term trend. Despite short-term buying dominance, technical signals suggest the asset is likely to consolidate sideways within a defined range, with limited breakout potential and continued downside risk.


-
 Afghanistan
-
 Albania
-
 Algeria
-
 Angola
-
 Argentina
-
 Armenia
-
 Australia
-
 Austria
-
 Azerbaijan
-
 Bahamas
-
 Bahrain
-
 Bangladesh
-
 Belarus
-
 Belgium
-
 Bolivia
-
 Botswana
-
 Brazil
-
 Brunei
-
 Bulgaria
-
 Cambodia
-
 Cameroon
-
 Canada
-
 Chile
Chile
-
 China
China
-
 Colombia
-
 Congo
Congo
-
 Costa Rica
-
 Cote d'Ivoire
-
 Croatia
-
 Cuba
Cuba
-
 Cyprus
-
 Czechia
-
 DR Congo
-
 Denmark
-
 Dominican Republic
-
 Ecuador
-
 Egypt
Egypt
-
 El Salvador
-
 Estonia
-
 Eswatini
-
 Ethiopia
-
 Finland
-
 France
-
 Georgia
-
 Germany
-
 Ghana
Ghana
-
 Greece
-
 Haiti
Haiti
-
 Hong Kong
-
 Hungary
-
 India
India
-
 Indonesia
-
 Iran, Islamic republic
-
 Iraq
Iraq
-
 Ireland
-
 Israel
-
 Italy
Italy
-
 Jamaica
-
 Japan
Japan
-
 Jordan
-
 Kazakhstan
-
 Kenya
Kenya
-
 Korea
Korea
-
 Kuwait
-
 Kyrgyzstan
-
 Laos
Laos
-
 Latvia
-
 Lebanon
-
 Lesotho
-
 Libya
Libya
-
 Lithuania
-
 Luxembourg
-
 Madagascar
-
 Malaysia
-
 Malta
Malta
-
 Mauritius
-
 Mexico
-
 Moldova
-
 Mongolia
-
 Montenegro
-
 Morocco
-
 Mozambique
-
 Myanmar
-
 Namibia
-
 Nepal
Nepal
-
 Netherlands
-
 New Zealand
-
 Nigeria
-
 North Macedonia
-
 Norway
-
 Oman
Oman
-
 Pakistan
-
 Palestine
-
 Panama
-
 Papua New Guinea
-
 Paraguay
-
 Peru
Peru
-
 Philippines
-
 Poland
-
 Portugal
-
 Puerto Rico
-
 Qatar
Qatar
-
 Reunion
-
 Romania
-
 Rwanda
-
 Saudi Arabia
-
 Serbia
-
 Singapore
-
 Slovakia
-
 Slovenia
-
 Somalia
-
 South Africa
-
 Spain
Spain
-
 Sri Lanka
-
 Sweden
-
 Switzerland
-
 Syria
Syria
-
 Taiwan
-
 Tajikistan
-
 Tanzania
-
 Thailand
-
 Trinidad and Tobago
-
 Tunisia
-
 Turkey
-
 UAE
UAE
-
 Uganda
-
 Ukraine
-
 United Kingdom
-
United States
-
 Uruguay
-
 Uzbekistan
-
 Venezuela
-
 Vietnam
-
 Yemen
Yemen
-
 Zambia
-
 Zimbabwe
- Forex
- Crypto
