
SHIB slides slightly as resistance at MA-20 caps any recovery attempts: weekly forecast

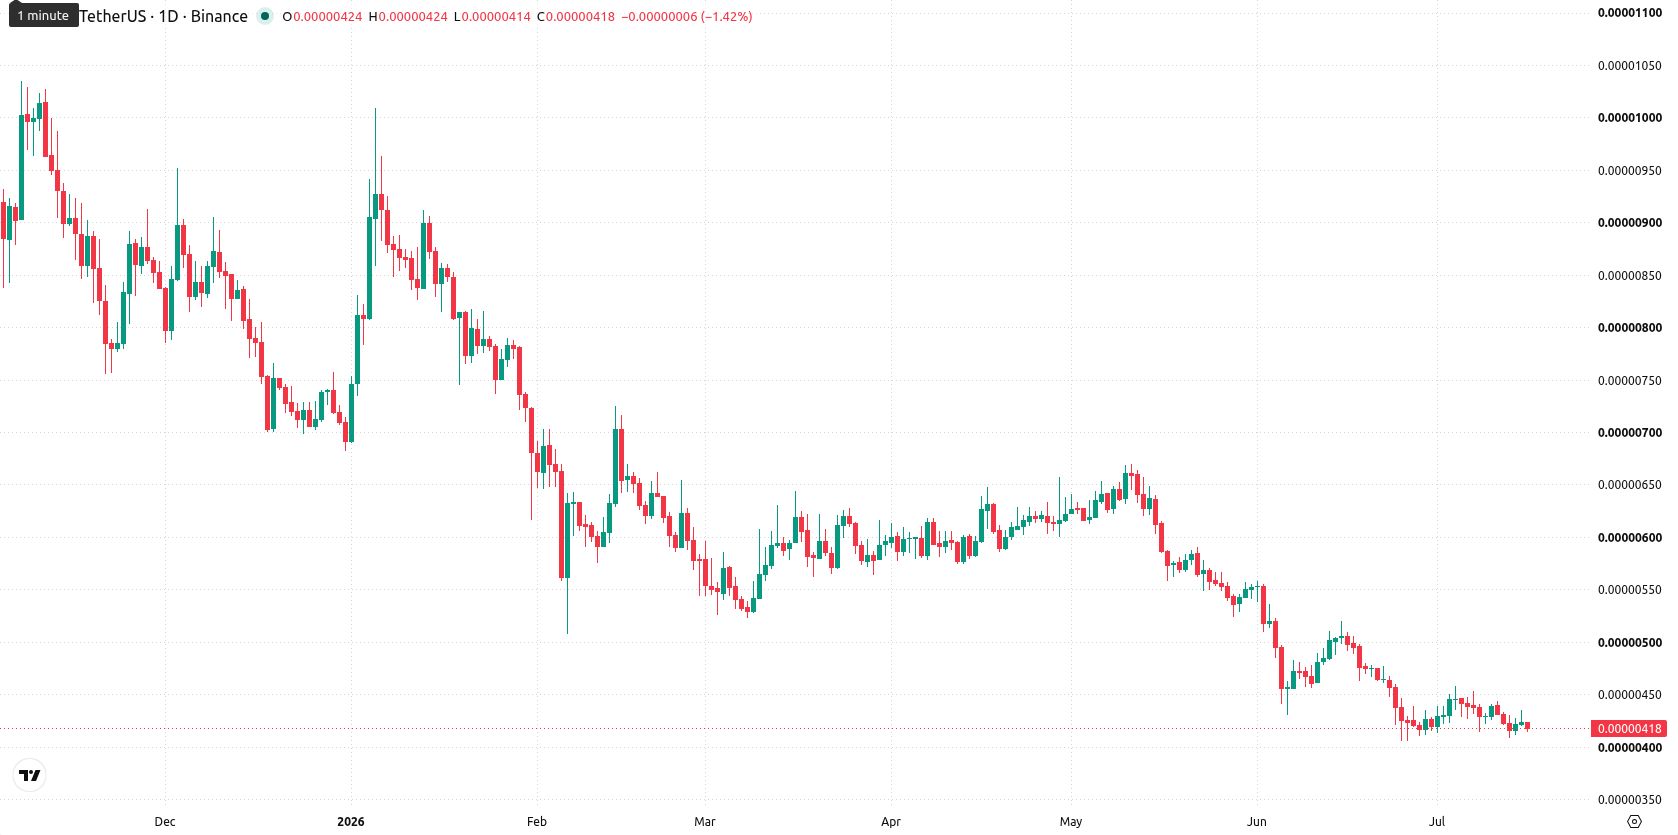
Shiba Inu (SHIB) is currently trading well below its weekly MA-20 ($0.00000538), MA-50 ($0.00000789), and MA-200 ($0.00001245), confirming sustained bearish pressure over both medium- and long-term timeframes. Over the past week, SHIB has fallen $0.0000001 (3.02%), positioning itself in the lower portion of its weekly range.
 0.0542
0.05435
0.0542
0.05435
Highlights
- SHIB remains under persistent bearish momentum, trading below major moving averages on medium- and long-term timeframes.
- Momentum and trend indicators point to strong selling pressure, with oscillators signaling oversold conditions and fading volatility.
- SHIB is expected to trade between $0.00000408 and $0.00000456 over the next week, with further downside more likely than a sustained rebound.
Burn surge and market listings drive supply squeeze hopes despite network dip
Robinhood completed a burn of 109 million SHIB tokens on July 12, increasing the weekly burn volume by over 680% and fueling interest in a potential supply squeeze. SHIB was also added to Japan's regulated Green List, improving access to one of Asia's largest crypto markets. Additional support came from its listing on Rakuten Wallet and a record low in SHIB exchange reserves, even as daily transactions on the Shibarium network declined sharply.
Sustained bearish momentum as oversold conditions deepen over the week
Weekly technicals remain firmly bearish, with SHIB trading well below the weekly MA-20 ($0.00000538), MA-50 ($0.00000789), and MA-200 ($0.00001245), and the Ichimoku Kijun set notably higher than the current price. The nearest resistance lies at the MA-20 level, while weekly volatility is 8.82%. Momentum is negative, as the MACD continues to signal a strong sell and the ADX affirms bearish dominance, though not yet at extreme levels. Both RSI and Stochastic RSI, along with CCI, indicate oversold conditions, and Bull/Bear Power confirms continued seller control.
Sideways trading expected as reversal signals remain weak this week
For the next 7 days, the weekly forecast projects a trading band between $0.00000408 and $0.00000456, in line with recent volatility. The probability of a sustained upside move remains very low (below 20%), given that key weekly indicators (RSI, ADX, MACD, CCI) do not signal a reversal. Most likely, SHIB will continue to trade sideways near current lows under the pressure of ongoing bearish momentum and oversold oscillators, with stabilization possible if buyers emerge. A clear break above $0.00000456 could shift momentum, but a decline below $0.00000408 would risk further losses.
Earlier, analysts noted that Shiba Inu was entrenched in a persistent bearish trend, with technicals and momentum indicators showing little sign of recovery. The latest developments, including heightened token burns and new market listings, strengthen this outlook while raising the importance of monitoring any shifts in buyer activity that could impact short-term volatility or signal an impending reversal.







-
 Afghanistan
-
 Albania
-
 Algeria
-
 Angola
-
 Argentina
-
 Armenia
-
 Australia
-
 Austria
-
 Azerbaijan
-
 Bahamas
-
 Bahrain
-
 Bangladesh
-
 Belarus
-
 Belgium
-
 Bolivia
-
 Botswana
-
 Brazil
-
 Brunei
-
 Bulgaria
-
 Cambodia
-
 Cameroon
-
 Canada
-
 Chile
Chile
-
 China
China
-
 Colombia
-
 Congo
Congo
-
 Costa Rica
-
 Cote d'Ivoire
-
 Croatia
-
 Cuba
Cuba
-
 Cyprus
-
 Czechia
-
 DR Congo
-
 Denmark
-
 Dominican Republic
-
 Ecuador
-
 Egypt
Egypt
-
 El Salvador
-
 Estonia
-
 Eswatini
-
 Ethiopia
-
 Finland
-
 France
-
 Georgia
-
 Germany
-
 Ghana
Ghana
-
 Greece
-
 Haiti
Haiti
-
 Hong Kong
-
 Hungary
-
 India
India
-
 Indonesia
-
 Iran, Islamic republic
-
 Iraq
Iraq
-
 Ireland
-
 Israel
-
 Italy
Italy
-
 Jamaica
-
 Japan
Japan
-
 Jordan
-
 Kazakhstan
-
 Kenya
Kenya
-
 Korea
Korea
-
 Kuwait
-
 Kyrgyzstan
-
 Laos
Laos
-
 Latvia
-
 Lebanon
-
 Lesotho
-
 Libya
Libya
-
 Lithuania
-
 Luxembourg
-
 Madagascar
-
 Malaysia
-
 Malta
Malta
-
 Mauritius
-
 Mexico
-
 Moldova
-
 Mongolia
-
 Montenegro
-
 Morocco
-
 Mozambique
-
 Myanmar
-
 Namibia
-
 Nepal
Nepal
-
 Netherlands
-
 New Zealand
-
 Nigeria
-
 North Macedonia
-
 Norway
-
 Oman
Oman
-
 Pakistan
-
 Palestine
-
 Panama
-
 Papua New Guinea
-
 Paraguay
-
 Peru
Peru
-
 Philippines
-
 Poland
-
 Portugal
-
 Puerto Rico
-
 Qatar
Qatar
-
 Reunion
-
 Romania
-
 Rwanda
-
 Saudi Arabia
-
 Serbia
-
 Singapore
-
 Slovakia
-
 Slovenia
-
 Somalia
-
 South Africa
-
 Spain
Spain
-
 Sri Lanka
-
 Sweden
-
 Switzerland
-
 Syria
Syria
-
 Taiwan
-
 Tajikistan
-
 Tanzania
-
 Thailand
-
 Trinidad and Tobago
-
 Tunisia
-
 Turkey
-
 UAE
UAE
-
 Uganda
-
 Ukraine
-
 United Kingdom
-
United States
-
 Uruguay
-
 Uzbekistan
-
 Venezuela
-
 Vietnam
-
 Yemen
Yemen
-
 Zambia
-
 Zimbabwe
- Forex
- Crypto











