
-7.04% for Maple — weak support and intraday volatility fuel bearish trend

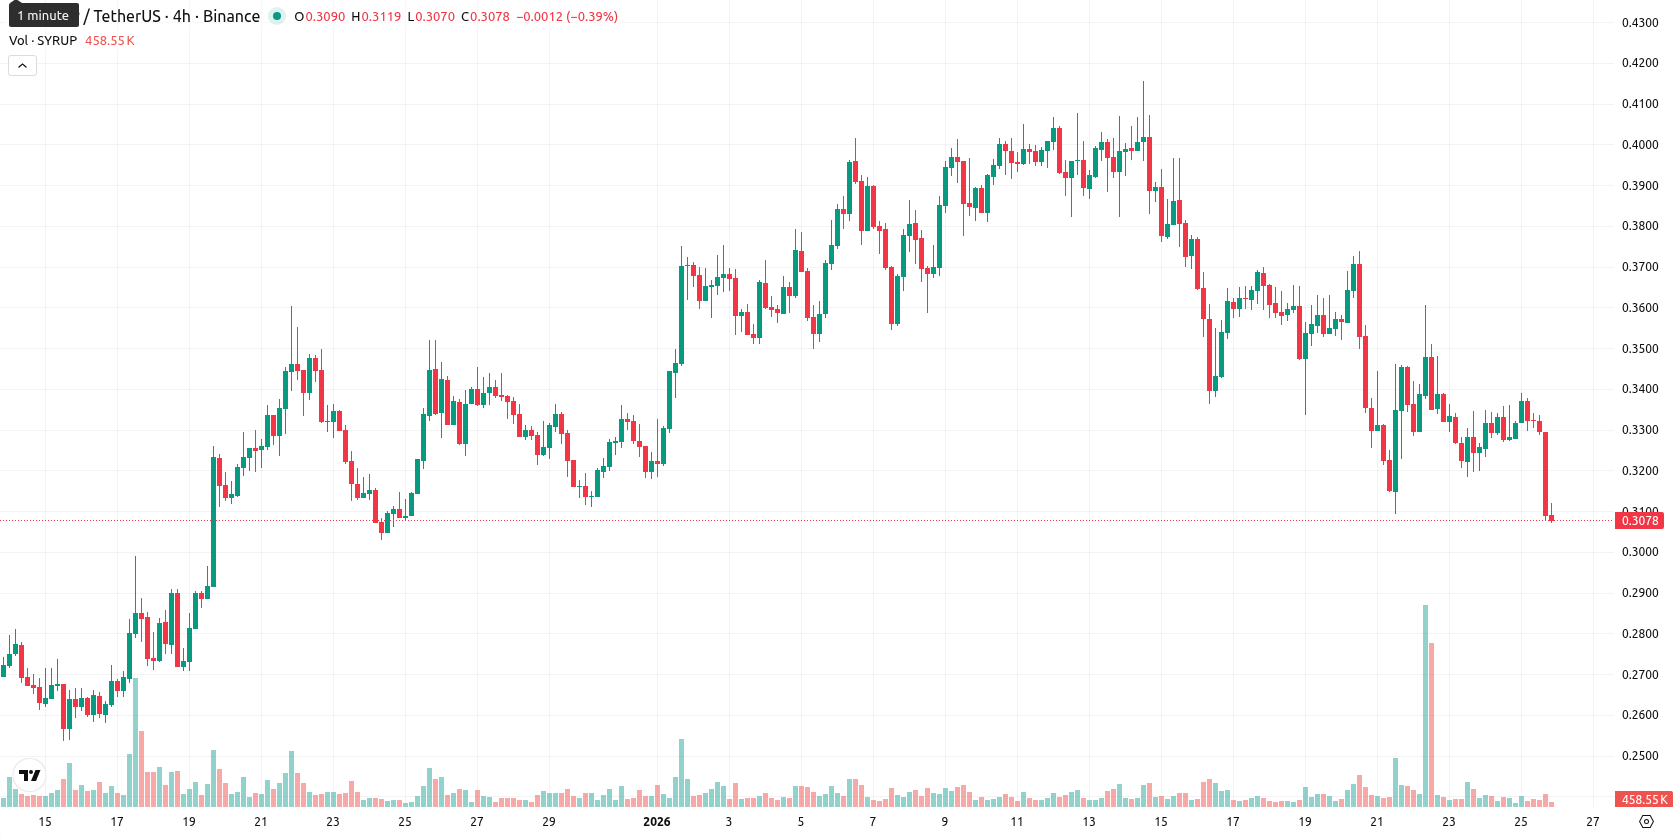
Maple (SYRUP) is trading at $0.3078, posting a daily decline of 7.04%. The asset remains well below its 20-day ($0.3677), 50-day ($0.3317), and 200-day ($0.3970) moving averages, underlining sustained bearish pressure across all major timeframes.
Highlights
- SYRUP is trading at $0.3078, significantly below the MA-20 ($0.3677), MA-50 ($0.3317), and MA-200 ($0.3970), demonstrating persistent multi-timeframe bearish pressure.
- Momentum indicators are weak to bearish, with MACD and ADX neutral to negative, and oscillators deeply oversold (RSI 42.25, CCI -118.99, Stochastic RSI) confirming seller dominance.
- Near-term price range is likely $0.304–$0.338 amid high volatility; a close above $0.3625 signals rebound, but a break below $0.304 risks further downside.
Downside momentum extends as resistance holds and indicators flash oversold
The nearest notable resistance for SYRUP on the daily chart is at the Ichimoku Kijun level of $0.3625, with no significant support offered by major moving averages. Technical indicators confirm a prevailing downtrend, as both MACD and ADX are neutral to bearish and show limited momentum, while the Awesome Oscillator also supports further downside prospects. Oscillators highlight oversold conditions — the RSI reads 42.25, CCI is at -118.99, and Stochastic RSI is deeply oversold — but Bull/Bear Power remains negative, confirming seller dominance during the session. Today's high intraday volatility and price action near daily lows are consistent with ongoing selling momentum after the open.
High probability downturn as volatility bands contract near recent lows
For the next five trading days, SYRUP is likely to trade within a volatility band between $0.304 and $0.338, tracking the current price area and reflecting historically elevated swings. Downward continuation carries a high probability (over 80%), with a sideways consolidation near recent lows as the baseline scenario. A close above $0.3625 could signal the start of a rebound, while a sustained drop below $0.304 support may prompt further declines due to apparent bearish momentum and the absence of confirmed buyers.
Previously it was reported that Maple (SYRUP) continues to face sustained selling pressure, trading below key short- and long-term moving averages, with weak momentum indicators and oversold RSI and oscillators challenging the prevailing downside bias. Despite oversold signals suggesting the potential for a limited technical rebound, the asset remains exposed to further declines unless resistance near $0.3440 is reclaimed.


-
 Afghanistan
-
 Albania
-
 Algeria
-
 Angola
-
 Argentina
-
 Armenia
-
 Australia
-
 Austria
-
 Azerbaijan
-
 Bahamas
-
 Bahrain
-
 Bangladesh
-
 Belarus
-
 Belgium
-
 Bolivia
-
 Botswana
-
 Brazil
-
 Brunei
-
 Bulgaria
-
 Cambodia
-
 Cameroon
-
 Canada
-
 Chile
Chile
-
 China
China
-
 Colombia
-
 Congo
Congo
-
 Costa Rica
-
 Cote d'Ivoire
-
 Croatia
-
 Cuba
Cuba
-
 Cyprus
-
 Czechia
-
 DR Congo
-
 Denmark
-
 Dominican Republic
-
 Ecuador
-
 Egypt
Egypt
-
 El Salvador
-
 Estonia
-
 Eswatini
-
 Ethiopia
-
 Finland
-
 France
-
 Georgia
-
 Germany
-
 Ghana
Ghana
-
 Greece
-
 Haiti
Haiti
-
 Hong Kong
-
 Hungary
-
 India
India
-
 Indonesia
-
 Iran, Islamic republic
-
 Iraq
Iraq
-
 Ireland
-
 Israel
-
 Italy
Italy
-
 Jamaica
-
 Japan
Japan
-
 Jordan
-
 Kazakhstan
-
 Kenya
Kenya
-
 Korea
Korea
-
 Kuwait
-
 Kyrgyzstan
-
 Laos
Laos
-
 Latvia
-
 Lebanon
-
 Lesotho
-
 Libya
Libya
-
 Lithuania
-
 Luxembourg
-
 Madagascar
-
 Malaysia
-
 Malta
Malta
-
 Mauritius
-
 Mexico
-
 Moldova
-
 Mongolia
-
 Montenegro
-
 Morocco
-
 Mozambique
-
 Myanmar
-
 Namibia
-
 Nepal
Nepal
-
 Netherlands
-
 New Zealand
-
 Nigeria
-
 North Macedonia
-
 Norway
-
 Oman
Oman
-
 Pakistan
-
 Palestine
-
 Panama
-
 Papua New Guinea
-
 Paraguay
-
 Peru
Peru
-
 Philippines
-
 Poland
-
 Portugal
-
 Puerto Rico
-
 Qatar
Qatar
-
 Reunion
-
 Romania
-
 Rwanda
-
 Saudi Arabia
-
 Serbia
-
 Singapore
-
 Slovakia
-
 Slovenia
-
 Somalia
-
 South Africa
-
 Spain
Spain
-
 Sri Lanka
-
 Sweden
-
 Switzerland
-
 Syria
Syria
-
 Taiwan
-
 Tajikistan
-
 Tanzania
-
 Thailand
-
 Trinidad and Tobago
-
 Tunisia
-
 Turkey
-
 UAE
UAE
-
 Uganda
-
 Ukraine
-
 United Kingdom
-
United States
-
 Uruguay
-
 Uzbekistan
-
 Venezuela
-
 Vietnam
-
 Yemen
Yemen
-
 Zambia
-
 Zimbabwe
- Forex
- Crypto
