
-9.25% for Aave — oversold technicals and downside volatility drive losses

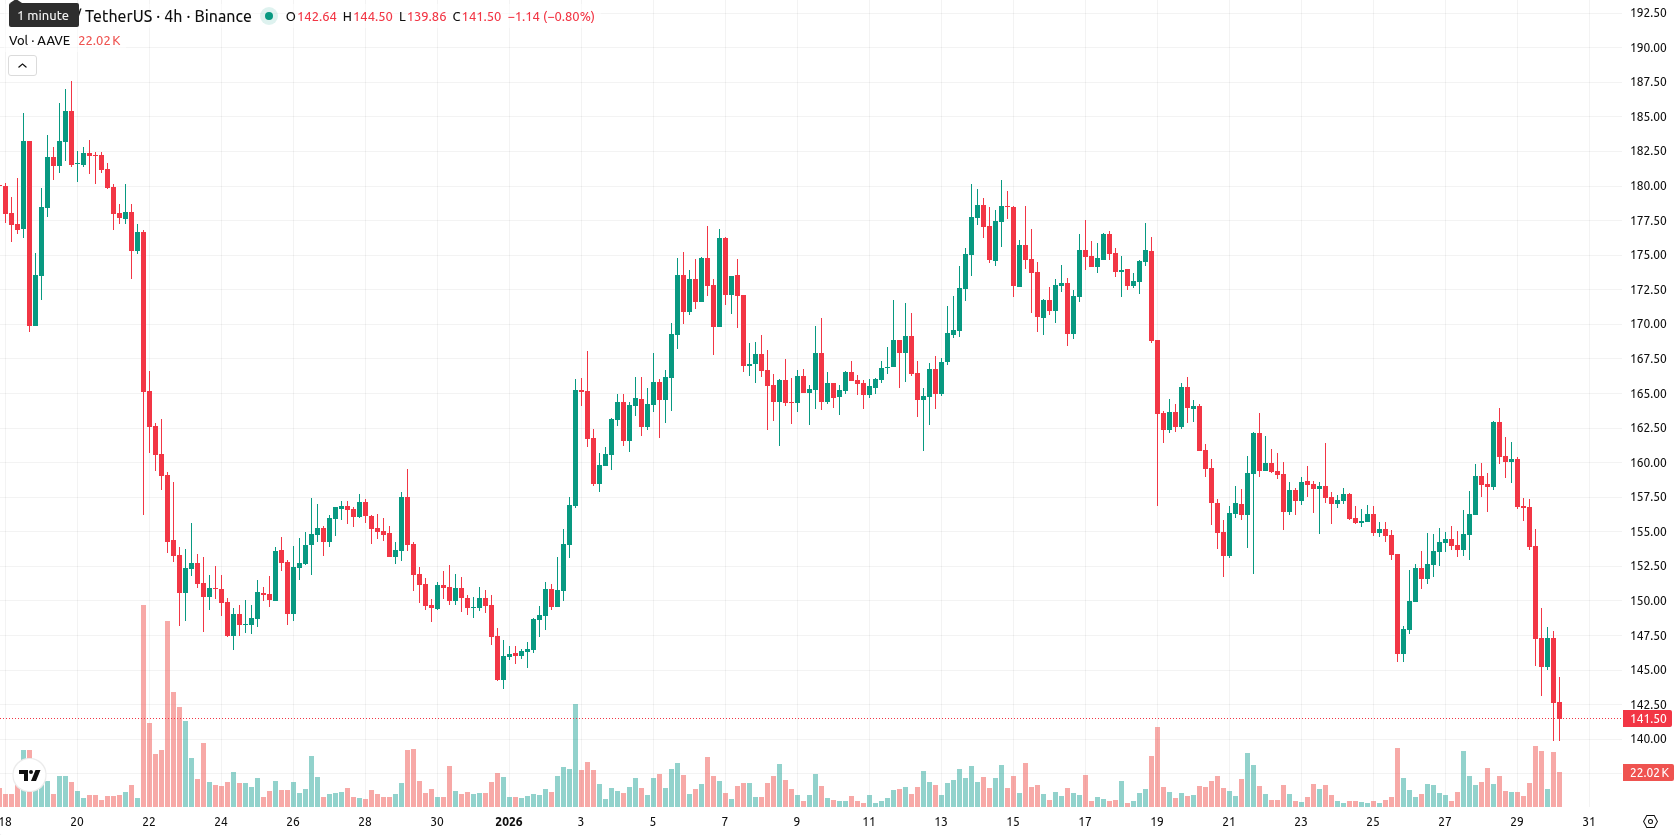
Aave (AAVE) is trading at $142.45, which is well below the MA-20 ($162.97), MA-50 ($165.89), and MA-200 ($235.92). This positioning beneath all major Moving Averages highlights pressure from sellers across timeframes, as AAVE remains deep under dynamic resistance with little immediate support from its trend lines.
Highlights
- AAVE trades at $142.45, significantly below the MA-20 ($162.97), MA-50 ($165.89), and MA-200 ($235.92), indicating persistent multi-timeframe bearish pressure.
- Momentum and oscillator indicators (MACD, ADX, RSI, Stochastic RSI, CCI) reinforce a strong bearish bias, with sellers dominating and no visible rebound despite oversold conditions.
- Expected trading range for the coming week is narrow at $139.90–$144.32, with under 20% probability of price recovery and potential for further declines if $139.90 breaks.
Oversold signals intensify with bearish momentum and volatile range
Momentum indicators display a pronounced bearish tone: the MACD shows continued downward momentum and the ADX also highlights strong selling force. Oscillators such as RSI and Stochastic RSI are both in oversold territory, and the CCI remains deeply negative, all confirming that AAVE is currently oversold without showing signs of rebound. Bull/Bear Power favors sellers on the intraday chart, and the Awesome Oscillator is neutral. With AAVE closing near the lower end of its daily range ($139.90–$147.78), heightened volatility persists and downside pressure dominates.
Limited upside as downside risk dominates short-term outlook
For the upcoming week, AAVE is likely to trade within the volatility band of $139.90 to $144.32, tightly clustered near current levels. The probability of an upside move is low (less than 20%), which makes additional declines or sideways movement the baseline scenario. A sustained move above $144.32 could indicate a recovery toward resistance at the Ichimoku Kijun, while a drop below $139.90 may result in further losses.
Last time, analysts noted that Aave was trading well below its key moving averages, with continued bearish momentum confirmed by MACD in sell territory and RSI remaining weak. The asset faces strong resistance near $162.95, heightened volatility, and intensified selling pressure, with no clear indications of a trend reversal at current levels.


-
 Afghanistan
-
 Albania
-
 Algeria
-
 Angola
-
 Argentina
-
 Armenia
-
 Australia
-
 Austria
-
 Azerbaijan
-
 Bahamas
-
 Bahrain
-
 Bangladesh
-
 Belarus
-
 Belgium
-
 Bolivia
-
 Botswana
-
 Brazil
-
 Brunei
-
 Bulgaria
-
 Cambodia
-
 Cameroon
-
 Canada
-
 Chile
Chile
-
 China
China
-
 Colombia
-
 Congo
Congo
-
 Costa Rica
-
 Cote d'Ivoire
-
 Croatia
-
 Cuba
Cuba
-
 Cyprus
-
 Czechia
-
 DR Congo
-
 Denmark
-
 Dominican Republic
-
 Ecuador
-
 Egypt
Egypt
-
 El Salvador
-
 Estonia
-
 Eswatini
-
 Ethiopia
-
 Finland
-
 France
-
 Georgia
-
 Germany
-
 Ghana
Ghana
-
 Greece
-
 Haiti
Haiti
-
 Hong Kong
-
 Hungary
-
 India
India
-
 Indonesia
-
 Iran, Islamic republic
-
 Iraq
Iraq
-
 Ireland
-
 Israel
-
 Italy
Italy
-
 Jamaica
-
 Japan
Japan
-
 Jordan
-
 Kazakhstan
-
 Kenya
Kenya
-
 Korea
Korea
-
 Kuwait
-
 Kyrgyzstan
-
 Laos
Laos
-
 Latvia
-
 Lebanon
-
 Lesotho
-
 Libya
Libya
-
 Lithuania
-
 Luxembourg
-
 Madagascar
-
 Malaysia
-
 Malta
Malta
-
 Mauritius
-
 Mexico
-
 Moldova
-
 Mongolia
-
 Montenegro
-
 Morocco
-
 Mozambique
-
 Myanmar
-
 Namibia
-
 Nepal
Nepal
-
 Netherlands
-
 New Zealand
-
 Nigeria
-
 North Macedonia
-
 Norway
-
 Oman
Oman
-
 Pakistan
-
 Palestine
-
 Panama
-
 Papua New Guinea
-
 Paraguay
-
 Peru
Peru
-
 Philippines
-
 Poland
-
 Portugal
-
 Puerto Rico
-
 Qatar
Qatar
-
 Reunion
-
 Romania
-
 Rwanda
-
 Saudi Arabia
-
 Serbia
-
 Singapore
-
 Slovakia
-
 Slovenia
-
 Somalia
-
 South Africa
-
 Spain
Spain
-
 Sri Lanka
-
 Sweden
-
 Switzerland
-
 Syria
Syria
-
 Taiwan
-
 Tajikistan
-
 Tanzania
-
 Thailand
-
 Trinidad and Tobago
-
 Tunisia
-
 Turkey
-
 UAE
UAE
-
 Uganda
-
 Ukraine
-
 United Kingdom
-
United States
-
 Uruguay
-
 Uzbekistan
-
 Venezuela
-
 Vietnam
-
 Yemen
Yemen
-
 Zambia
-
 Zimbabwe
- Forex
- Crypto
