
Ondo: Oversold conditions and bearish analysis drive further downside

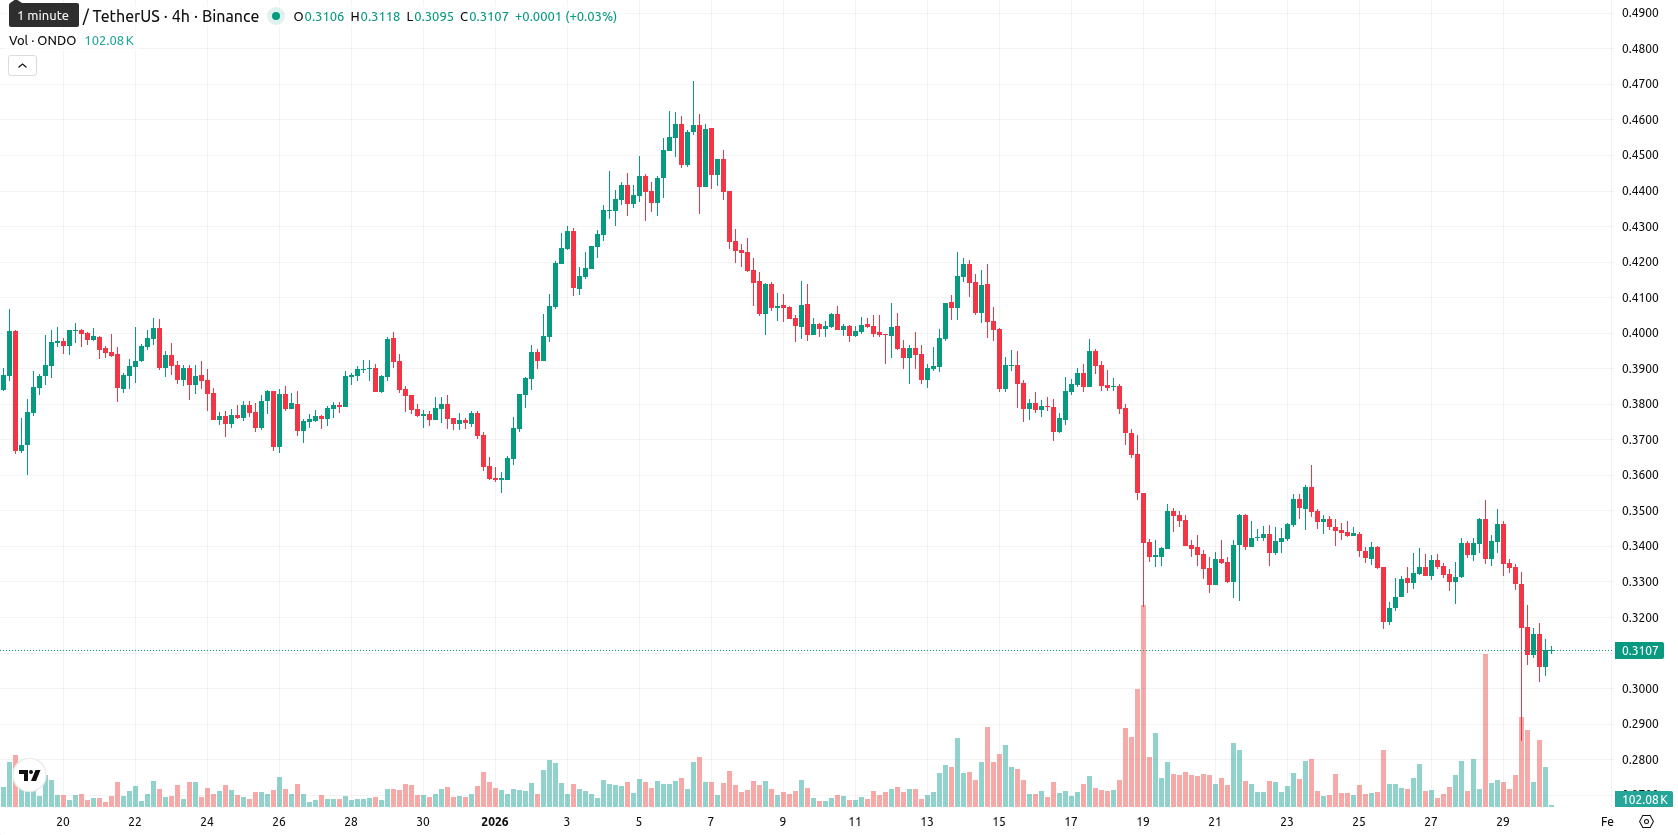
Ondo (ONDO) is trading well below its short-term, medium-term, and long-term Moving Averages, with the current price at $0.3108 compared to the MA-20 of $0.3607, MA-50 of $0.3888, and MA-200 of $0.7153. This alignment highlights sustained downward pressure across all timeframes, with immediate dynamic resistance at the Ichimoku Kijun of $0.3888 and no nearby support from higher averages.
Highlights
- Ondo Finance launched USDY, a yield-bearing token backed by short-term U.S. Treasuries and bank deposits, as the first permissionless treasury asset on the Sei Network.
- Ondo Finance’s total value locked exceeded $2.5 billion by late January 2026, signaling significant institutional growth in real-world asset tokenization.
- ONDO trades at $0.3108, well below MA-20 ($0.3607), MA-50 ($0.3888), and MA-200 ($0.7153), with persistent bearish momentum and a projected five-day range of $0.2950–$0.3460.
Tokenized treasury launch on Sei drives asset inflow and visibility
Ondo Finance has launched its yield-bearing token USDY on the Sei Network, introducing the first permissionless tokenized U.S. Treasury-based asset to that platform. USDY is backed by short-term U.S. Treasury bonds and bank deposits, providing Sei ecosystem participants exposure to yield-generating treasury assets. Ondo Finance’s total value locked surpassed $2.5 billion as of late January 2026, underscoring its growing presence in tokenized real-world assets.
Bearish momentum and volatility persist amid oversold signals
Momentum remains firmly bearish, confirmed by negative signals from both the MACD and the ADX. The Relative Strength Index and Stochastic RSI are approaching or in oversold territory, while the Commodity Channel Index also suggests an oversold market, but with sellers still dominant according to Bull/Bear Power. The Awesome Oscillator reinforces the downside signal, with ONDO declining sharply today after a minor gap down between yesterday’s close and today’s open. The price remains near the lower end of today’s range, reflecting persistent selling pressure and high intraday volatility, with short-term momentum aligning with the overall bearish structure.
Limited upside as bearish indicators constrain five-day outlook
For the next five trading days, the expected price range for ONDO is $0.2950 to $0.3460, reflecting a typical volatility band relative to current levels. There is a low probability (less than 20%) of an upward move, given the consistently bearish signals across daily and weekly indicators. In the base case, ONDO consolidates sideways within this corridor; an upside break above $0.3460 could target higher resistance but remains unlikely, while a move below $0.2950 would indicate further downside as seller momentum persists.
Last time, analysts noted that ONDO is trading well below its key moving averages, with pronounced bearish momentum reinforced by negative MACD, weak RSI, and strong selling pressure. Technical signals indicate continued downside, lacking solid support and facing dynamic resistance at the Ichimoku Kijun, with consolidation likely barring a significant shift in sentiment.


-
 Afghanistan
-
 Albania
-
 Algeria
-
 Angola
-
 Argentina
-
 Armenia
-
 Australia
-
 Austria
-
 Azerbaijan
-
 Bahamas
-
 Bahrain
-
 Bangladesh
-
 Belarus
-
 Belgium
-
 Bolivia
-
 Botswana
-
 Brazil
-
 Brunei
-
 Bulgaria
-
 Cambodia
-
 Cameroon
-
 Canada
-
 Chile
Chile
-
 China
China
-
 Colombia
-
 Congo
Congo
-
 Costa Rica
-
 Cote d'Ivoire
-
 Croatia
-
 Cuba
Cuba
-
 Cyprus
-
 Czechia
-
 DR Congo
-
 Denmark
-
 Dominican Republic
-
 Ecuador
-
 Egypt
Egypt
-
 El Salvador
-
 Estonia
-
 Eswatini
-
 Ethiopia
-
 Finland
-
 France
-
 Georgia
-
 Germany
-
 Ghana
Ghana
-
 Greece
-
 Haiti
Haiti
-
 Hong Kong
-
 Hungary
-
 India
India
-
 Indonesia
-
 Iran, Islamic republic
-
 Iraq
Iraq
-
 Ireland
-
 Israel
-
 Italy
Italy
-
 Jamaica
-
 Japan
Japan
-
 Jordan
-
 Kazakhstan
-
 Kenya
Kenya
-
 Korea
Korea
-
 Kuwait
-
 Kyrgyzstan
-
 Laos
Laos
-
 Latvia
-
 Lebanon
-
 Lesotho
-
 Libya
Libya
-
 Lithuania
-
 Luxembourg
-
 Madagascar
-
 Malaysia
-
 Malta
Malta
-
 Mauritius
-
 Mexico
-
 Moldova
-
 Mongolia
-
 Montenegro
-
 Morocco
-
 Mozambique
-
 Myanmar
-
 Namibia
-
 Nepal
Nepal
-
 Netherlands
-
 New Zealand
-
 Nigeria
-
 North Macedonia
-
 Norway
-
 Oman
Oman
-
 Pakistan
-
 Palestine
-
 Panama
-
 Papua New Guinea
-
 Paraguay
-
 Peru
Peru
-
 Philippines
-
 Poland
-
 Portugal
-
 Puerto Rico
-
 Qatar
Qatar
-
 Reunion
-
 Romania
-
 Rwanda
-
 Saudi Arabia
-
 Serbia
-
 Singapore
-
 Slovakia
-
 Slovenia
-
 Somalia
-
 South Africa
-
 Spain
Spain
-
 Sri Lanka
-
 Sweden
-
 Switzerland
-
 Syria
Syria
-
 Taiwan
-
 Tajikistan
-
 Tanzania
-
 Thailand
-
 Trinidad and Tobago
-
 Tunisia
-
 Turkey
-
 UAE
UAE
-
 Uganda
-
 Ukraine
-
 United Kingdom
-
United States
-
 Uruguay
-
 Uzbekistan
-
 Venezuela
-
 Vietnam
-
 Yemen
Yemen
-
 Zambia
-
 Zimbabwe
- Forex
- Crypto
