
Celestia: Bearish momentum and volatility drive continued sharp losses

Celestia (TIA) is trading at $0.4042, showing a daily decline and positioning firmly below the MA-20 ($0.5032), MA-50 ($0.5051), and MA-200 ($1,143.7), maintaining sustained downside momentum across all observed timeframes.
Highlights
- TIA is trading at $0.4042, below its MA-20 ($0.5032), MA-50 ($0.5051), and MA-200 ($1.1437), signaling sustained multi-timeframe downside pressure.
- Momentum indicators—including MACD, ADX, RSI (34.5), Stochastic RSI (2.4), and CCI (–101.8)—confirm bearish dominance with oversold conditions and heavy short-term capitulation.
- The expected five-day range is $0.3950–$0.4250 with over 80% probability of further declines; a break below $0.3950 would trigger a deeper selloff.
Bearish control persists as oscillators confirm elevated volatility
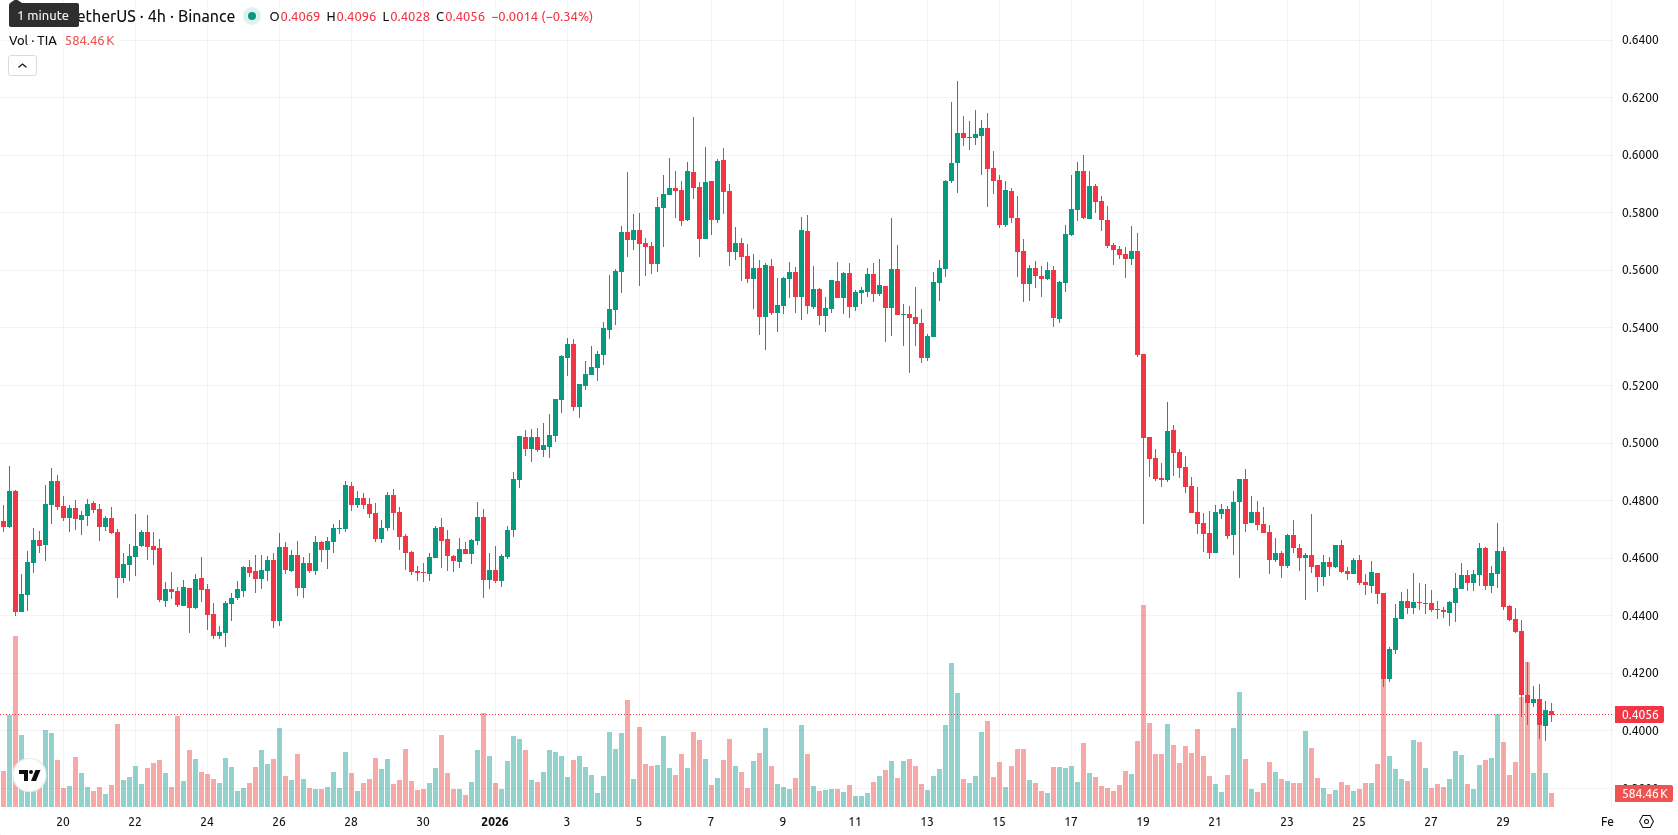
Technically, TIA faces persistent bearish momentum as it remains below all major moving averages. The immediate resistance is set by the Ichimoku Kijun at $0.5138, while there is no dynamic technical support nearby, emphasizing ongoing vulnerability. Bearish control is illustrated by the MACD and ADX, with additional confirmation from oversold readings in the RSI (34.5), Stochastic RSI (2.4), and CCI (–101.8). The session began with a gap down from $0.4405 to $0.4115, and price action hovers near the intraday low of $0.3964, with elevated volatility and no signs of reversal.
Downside risk prevails as support remains absent in short term
In the short term, TIA is expected to trade within a typical volatility band between $0.3950 and $0.4250. There is a high probability, over 80%, of continued downside given the persistent bearish technical signals across all key indicators. If the price breaks below $0.3950, further losses are likely due to the absence of clear support; any meaningful recovery would require a move above the $0.4250– $0.4300 resistance area.
Last time, analysts noted that Celestia (TIA) continues to exhibit strong bearish momentum, trading below all major moving averages with sellers maintaining control across short- and long-term trends. Momentum indicators including MACD RSI and CCI confirm oversold conditions, while immediate resistance is found at $0.5214 and the lack of dynamic support suggests further downside risk amid heightened volatility.


-
 Afghanistan
-
 Albania
-
 Algeria
-
 Angola
-
 Argentina
-
 Armenia
-
 Australia
-
 Austria
-
 Azerbaijan
-
 Bahamas
-
 Bahrain
-
 Bangladesh
-
 Belarus
-
 Belgium
-
 Bolivia
-
 Botswana
-
 Brazil
-
 Brunei
-
 Bulgaria
-
 Cambodia
-
 Cameroon
-
 Canada
-
 Chile
Chile
-
 China
China
-
 Colombia
-
 Congo
Congo
-
 Costa Rica
-
 Cote d'Ivoire
-
 Croatia
-
 Cuba
Cuba
-
 Cyprus
-
 Czechia
-
 DR Congo
-
 Denmark
-
 Dominican Republic
-
 Ecuador
-
 Egypt
Egypt
-
 El Salvador
-
 Estonia
-
 Eswatini
-
 Ethiopia
-
 Finland
-
 France
-
 Georgia
-
 Germany
-
 Ghana
Ghana
-
 Greece
-
 Haiti
Haiti
-
 Hong Kong
-
 Hungary
-
 India
India
-
 Indonesia
-
 Iran, Islamic republic
-
 Iraq
Iraq
-
 Ireland
-
 Israel
-
 Italy
Italy
-
 Jamaica
-
 Japan
Japan
-
 Jordan
-
 Kazakhstan
-
 Kenya
Kenya
-
 Korea
Korea
-
 Kuwait
-
 Kyrgyzstan
-
 Laos
Laos
-
 Latvia
-
 Lebanon
-
 Lesotho
-
 Libya
Libya
-
 Lithuania
-
 Luxembourg
-
 Madagascar
-
 Malaysia
-
 Malta
Malta
-
 Mauritius
-
 Mexico
-
 Moldova
-
 Mongolia
-
 Montenegro
-
 Morocco
-
 Mozambique
-
 Myanmar
-
 Namibia
-
 Nepal
Nepal
-
 Netherlands
-
 New Zealand
-
 Nigeria
-
 North Macedonia
-
 Norway
-
 Oman
Oman
-
 Pakistan
-
 Palestine
-
 Panama
-
 Papua New Guinea
-
 Paraguay
-
 Peru
Peru
-
 Philippines
-
 Poland
-
 Portugal
-
 Puerto Rico
-
 Qatar
Qatar
-
 Reunion
-
 Romania
-
 Rwanda
-
 Saudi Arabia
-
 Serbia
-
 Singapore
-
 Slovakia
-
 Slovenia
-
 Somalia
-
 South Africa
-
 Spain
Spain
-
 Sri Lanka
-
 Sweden
-
 Switzerland
-
 Syria
Syria
-
 Taiwan
-
 Tajikistan
-
 Tanzania
-
 Thailand
-
 Trinidad and Tobago
-
 Tunisia
-
 Turkey
-
 UAE
UAE
-
 Uganda
-
 Ukraine
-
 United Kingdom
-
United States
-
 Uruguay
-
 Uzbekistan
-
 Venezuela
-
 Vietnam
-
 Yemen
Yemen
-
 Zambia
-
 Zimbabwe
- Forex
- Crypto
