
Technical breakdown and heavy selling — Pendle slips 8.51%

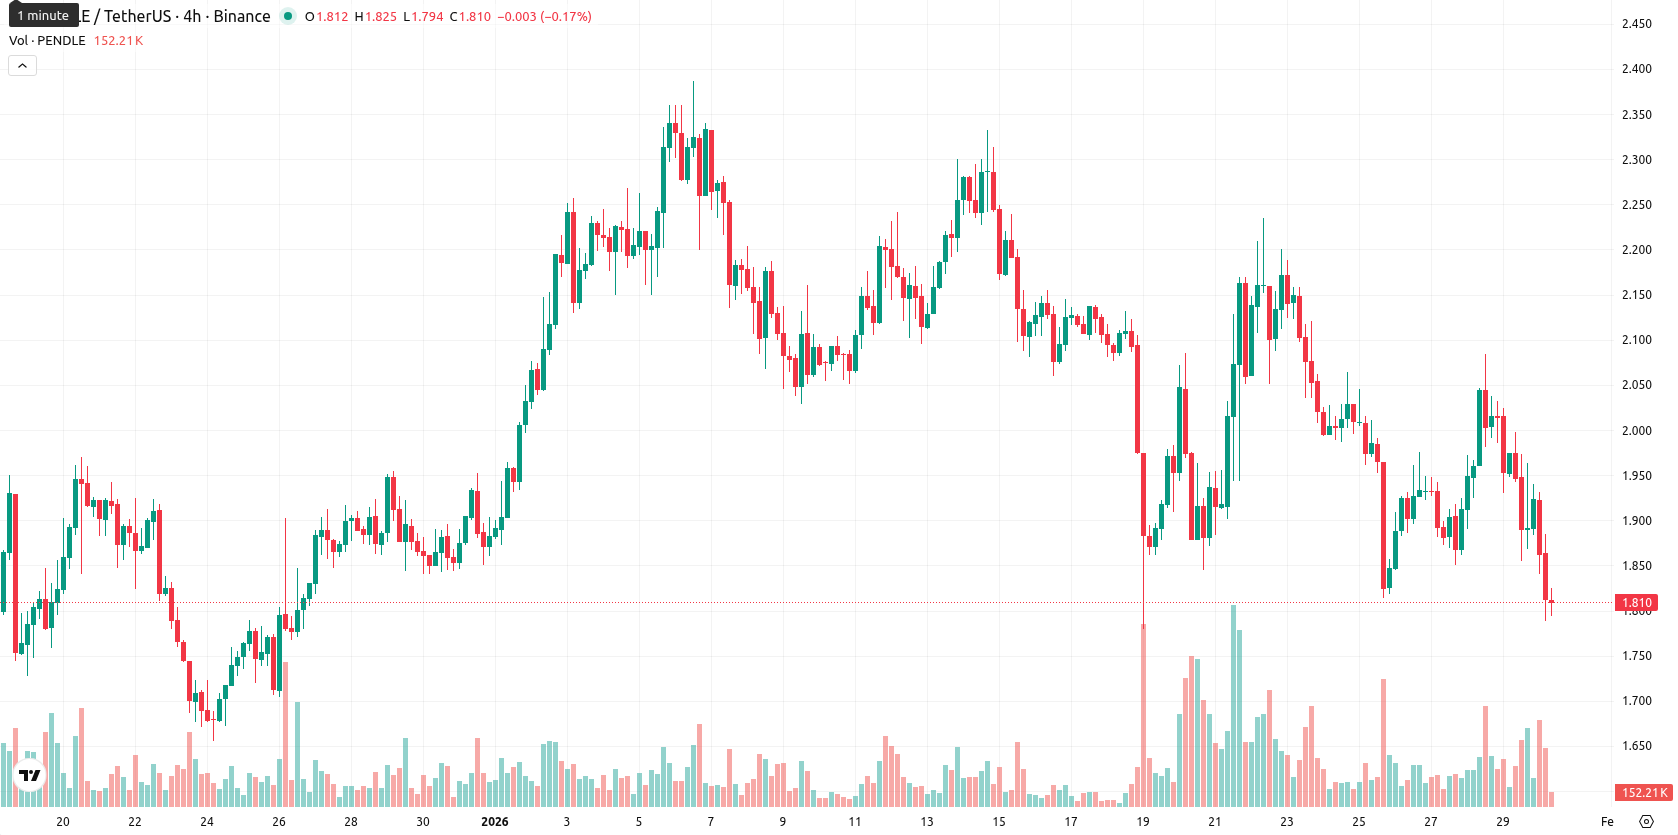
Pendle (PENDLE) is trading well below the MA-20 ($2.0498), MA-50 ($2.0192), and MA-200 ($3.4999), indicating persistent downward pressure over short, medium, and long timeframes. The daily price action reflects strong seller dominance, with the asset nearing session lows and displaying high volatility since the open.
Highlights
- PENDLE trades decisively below key moving averages—MA-20 ($2.0498), MA-50 ($2.0192), and MA-200 ($3.4999)—signaling persistent short-, medium-, and long-term selling pressure.
- Momentum indicators remain bearish, with MACD in a sell configuration, ADX showing weak trend strength, and multiple oscillators (Stochastic RSI, CCI) registering oversold conditions.
- The baseline scenario is consolidation between $1.75 and $2.10 for the coming week, as no bullish signals emerge and a breakdown below $1.75 could accelerate further declines.
Persistent negative momentum as resistance holds and buyers lag
Technically, PENDLE's nearest dynamic resistance sits at the Ichimoku Kijun ($2.0835), with no significant support level evident on current timeframes. Momentum signals remain negative — the MACD is in a sell configuration, and ADX shows weak trend strength. RSI is below mid-range but not quite in oversold territory; both the Stochastic RSI and Commodity Channel Index signal oversold conditions. Bull/Bear Power points to slight buyer interest, but sellers dominate intraday movement, as confirmed by the Awesome Oscillator’s steady bearish signal. Despite some signs of oversold conditions, overall momentum and breadth strongly favor sellers.
Consolidation expected as bullish reversal signals remain weak
In the short term, PENDLE is likely to trade between $1.75 and $2.10, which aligns with its typical volatility band relative to current levels. There is less than a 20% probability of a near-term upward reversal, as bullish signals are absent on MACD, RSI, and moving averages. The base case is a period of consolidation in the $1.75 to $2.10 range. A breakout above the Ichimoku Kijun resistance at $2.08 could trigger a test of the upper end of the range, but if price slips below $1.75, further acceleration to the downside is likely.
Previously it was reported that Pendle (PENDLE) is trading just above its short-term moving averages but remains well below its long-term MA-200, signaling short-term stabilization amid overall bearish pressure. Momentum indicators including MACD and ADX are weak and mixed, with mild oversold signals from RSI and CCI, while immediate resistance is indicated by the Ichimoku Kijun, and price action shows strong intraday gains but persistent medium-term caution.


-
 Afghanistan
-
 Albania
-
 Algeria
-
 Angola
-
 Argentina
-
 Armenia
-
 Australia
-
 Austria
-
 Azerbaijan
-
 Bahamas
-
 Bahrain
-
 Bangladesh
-
 Belarus
-
 Belgium
-
 Bolivia
-
 Botswana
-
 Brazil
-
 Brunei
-
 Bulgaria
-
 Cambodia
-
 Cameroon
-
 Canada
-
 Chile
Chile
-
 China
China
-
 Colombia
-
 Congo
Congo
-
 Costa Rica
-
 Cote d'Ivoire
-
 Croatia
-
 Cuba
Cuba
-
 Cyprus
-
 Czechia
-
 DR Congo
-
 Denmark
-
 Dominican Republic
-
 Ecuador
-
 Egypt
Egypt
-
 El Salvador
-
 Estonia
-
 Eswatini
-
 Ethiopia
-
 Finland
-
 France
-
 Georgia
-
 Germany
-
 Ghana
Ghana
-
 Greece
-
 Haiti
Haiti
-
 Hong Kong
-
 Hungary
-
 India
India
-
 Indonesia
-
 Iran, Islamic republic
-
 Iraq
Iraq
-
 Ireland
-
 Israel
-
 Italy
Italy
-
 Jamaica
-
 Japan
Japan
-
 Jordan
-
 Kazakhstan
-
 Kenya
Kenya
-
 Korea
Korea
-
 Kuwait
-
 Kyrgyzstan
-
 Laos
Laos
-
 Latvia
-
 Lebanon
-
 Lesotho
-
 Libya
Libya
-
 Lithuania
-
 Luxembourg
-
 Madagascar
-
 Malaysia
-
 Malta
Malta
-
 Mauritius
-
 Mexico
-
 Moldova
-
 Mongolia
-
 Montenegro
-
 Morocco
-
 Mozambique
-
 Myanmar
-
 Namibia
-
 Nepal
Nepal
-
 Netherlands
-
 New Zealand
-
 Nigeria
-
 North Macedonia
-
 Norway
-
 Oman
Oman
-
 Pakistan
-
 Palestine
-
 Panama
-
 Papua New Guinea
-
 Paraguay
-
 Peru
Peru
-
 Philippines
-
 Poland
-
 Portugal
-
 Puerto Rico
-
 Qatar
Qatar
-
 Reunion
-
 Romania
-
 Rwanda
-
 Saudi Arabia
-
 Serbia
-
 Singapore
-
 Slovakia
-
 Slovenia
-
 Somalia
-
 South Africa
-
 Spain
Spain
-
 Sri Lanka
-
 Sweden
-
 Switzerland
-
 Syria
Syria
-
 Taiwan
-
 Tajikistan
-
 Tanzania
-
 Thailand
-
 Trinidad and Tobago
-
 Tunisia
-
 Turkey
-
 UAE
UAE
-
 Uganda
-
 Ukraine
-
 United Kingdom
-
United States
-
 Uruguay
-
 Uzbekistan
-
 Venezuela
-
 Vietnam
-
 Yemen
Yemen
-
 Zambia
-
 Zimbabwe
- Forex
- Crypto
