
Pendle declines 11.08% as sellers dominate and indicators point lower

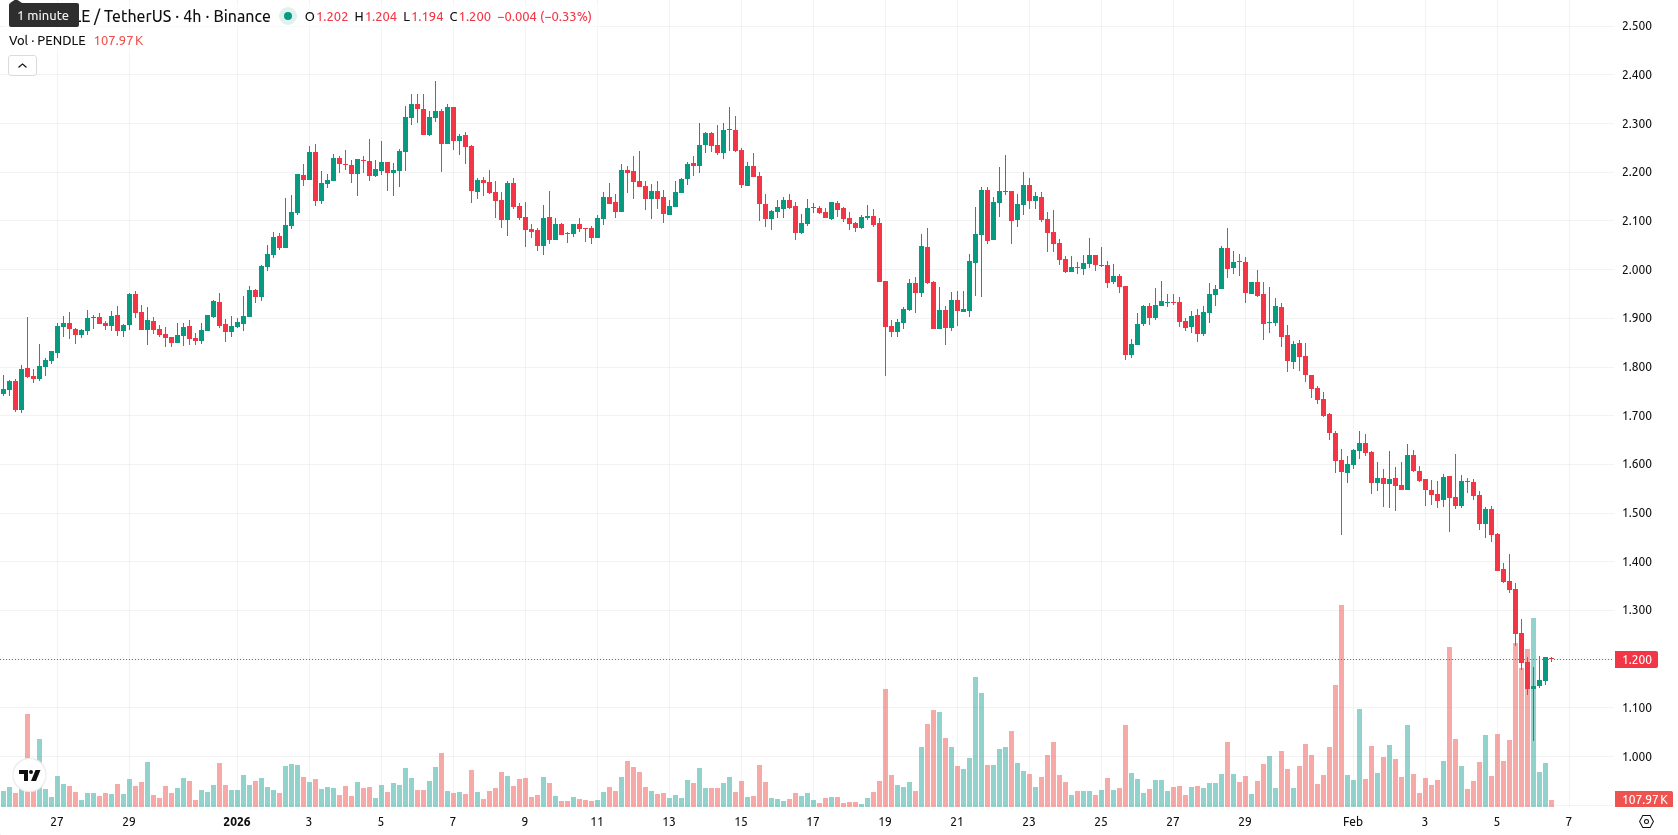
Pendle (PENDLE) is trading at $1.196, having opened with a significant gap down and declining by 11.08% on the session. The asset remains well below its MA-20 ($1.8244), MA-50 ($1.9380), and MA-200 ($3,4028), confirming sustained seller dominance across all observed trends.
Highlights
- Pendle is trading at $1.196, significantly below its MA-20 ($1.8244), MA-50 ($1.9380), and MA-200 ($3.4028), confirming seller pressure across all timeframes.
- All major momentum indicators—MACD, ADX, RSI, CCI, Stochastic RSI, and Awesome Oscillator—are firmly bearish with no signs of bullish divergence, reinforcing the negative outlook.
- For the coming week, Pendle's expected price corridor is $1.08 to $1.32, with a much higher probability of further decline unless a sustained breakout above $1.32 occurs.
Fresh lows as bearish signals converge and support erodes
All technical signals reinforce a bearish outlook for PENDLE. The Ichimoku Kijun at $1.7290 stands out as the primary resistance, while notable support is lacking beneath current prices. Momentum indicators such as the MACD remain in sell territory, ADX signals weak trend strength, and both RSI and Commodity Channel Index show oversold conditions. The Stochastic RSI and Awesome Oscillator also suggest further weakness, and Bull/Bear Power readings confirm persistent seller pressure; the price is holding near the upper end of the day’s volatile range without meaningful recovery, while all oscillators align on a negative stance.
Sideways bias expected as oversold conditions curb downside risk
Looking ahead, PENDLE is likely to trade within a typical volatility band of $1.08 to $1.32 over the coming week. Ongoing oversold conditions should restrict sharp additional declines, favoring sideways price action inside this corridor. A bullish turn would require surpassing the $1.32 resistance, which could trigger short-term covering, while a drop below $1.08 risks intensifying the prevailing downtrend.
Previously it was reported that Pendle (PENDLE) is exhibiting intensified bearish momentum, trading well below all major moving averages and facing persistent selling pressure as momentum indicators such as RSI MACD and ADX confirm deeply oversold conditions. Immediate support is near the session’s low, while resistance remains at the Ichimoku Kijun, suggesting the asset is likely to remain under downside pressure unless a breakout above resistance occurs.


-
 Afghanistan
-
 Albania
-
 Algeria
-
 Angola
-
 Argentina
-
 Armenia
-
 Australia
-
 Austria
-
 Azerbaijan
-
 Bahamas
-
 Bahrain
-
 Bangladesh
-
 Belarus
-
 Belgium
-
 Bolivia
-
 Botswana
-
 Brazil
-
 Brunei
-
 Bulgaria
-
 Cambodia
-
 Cameroon
-
 Canada
-
 Chile
Chile
-
 China
China
-
 Colombia
-
 Congo
Congo
-
 Costa Rica
-
 Cote d'Ivoire
-
 Croatia
-
 Cuba
Cuba
-
 Cyprus
-
 Czechia
-
 DR Congo
-
 Denmark
-
 Dominican Republic
-
 Ecuador
-
 Egypt
Egypt
-
 El Salvador
-
 Estonia
-
 Eswatini
-
 Ethiopia
-
 Finland
-
 France
-
 Georgia
-
 Germany
-
 Ghana
Ghana
-
 Greece
-
 Haiti
Haiti
-
 Hong Kong
-
 Hungary
-
 India
India
-
 Indonesia
-
 Iran, Islamic republic
-
 Iraq
Iraq
-
 Ireland
-
 Israel
-
 Italy
Italy
-
 Jamaica
-
 Japan
Japan
-
 Jordan
-
 Kazakhstan
-
 Kenya
Kenya
-
 Korea
Korea
-
 Kuwait
-
 Kyrgyzstan
-
 Laos
Laos
-
 Latvia
-
 Lebanon
-
 Lesotho
-
 Libya
Libya
-
 Lithuania
-
 Luxembourg
-
 Madagascar
-
 Malaysia
-
 Malta
Malta
-
 Mauritius
-
 Mexico
-
 Moldova
-
 Mongolia
-
 Montenegro
-
 Morocco
-
 Mozambique
-
 Myanmar
-
 Namibia
-
 Nepal
Nepal
-
 Netherlands
-
 New Zealand
-
 Nigeria
-
 North Macedonia
-
 Norway
-
 Oman
Oman
-
 Pakistan
-
 Palestine
-
 Panama
-
 Papua New Guinea
-
 Paraguay
-
 Peru
Peru
-
 Philippines
-
 Poland
-
 Portugal
-
 Puerto Rico
-
 Qatar
Qatar
-
 Reunion
-
 Romania
-
 Rwanda
-
 Saudi Arabia
-
 Serbia
-
 Singapore
-
 Slovakia
-
 Slovenia
-
 Somalia
-
 South Africa
-
 Spain
Spain
-
 Sri Lanka
-
 Sweden
-
 Switzerland
-
 Syria
Syria
-
 Taiwan
-
 Tajikistan
-
 Tanzania
-
 Thailand
-
 Trinidad and Tobago
-
 Tunisia
-
 Turkey
-
 UAE
UAE
-
 Uganda
-
 Ukraine
-
 United Kingdom
-
United States
-
 Uruguay
-
 Uzbekistan
-
 Venezuela
-
 Vietnam
-
 Yemen
Yemen
-
 Zambia
-
 Zimbabwe
- Forex
- Crypto
